
Slideshow:


Karlovo is a small city, rich of surrounding natural forests, but a low level of urban green spaces.
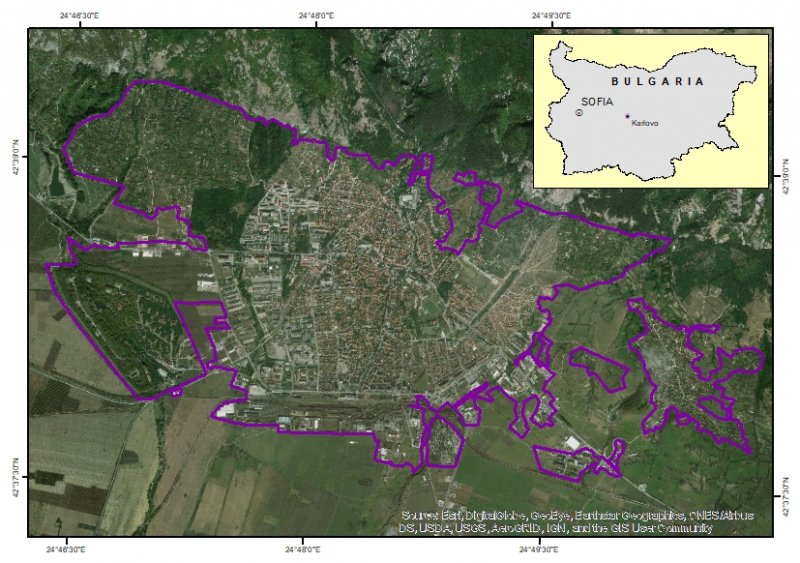
Figure 1 Map of Karlovo (based on Google maps)
The main ecological problems are related to the poor phytosanitary status of urban green spaces, the need for regulation of the local climate and for mitigating flood risk. The city is interested in the services provided by urban green spaces and how they should be maintained so as to contribute to the residents’ quality of life. By undertaking an integrated approach the city seeks to protect the existing tree cover, to implement best management practices, and to engage local officials and the public in planning, sustaining, and improving forest resources in and around towns and villages in the region.
Policy questions:
1. Are green spaces in Karlovo and the region healthy enough to continue supplying ecosystem services?
- Which are the areas where the urban landscape should be gentrified by green spaces
- How should the green spaces be maintained to have the greatest impact on human well-being and the environment?
2. What are the potential effects, both positive and negative ones, of UGI and ecosystem services on agricultural and climate policy as well as disaster risk reduction at local and regional level in Karlovo?
- Which territories can benefit most of such activities for development?
- How can urban green spaces contribute to the improvement of welfare in urban regions (e.g. by creating or restoring urban and peri-urban forest parks, multiple-use, etc.)?
3. What kind of knowledge is still needed for local authorities to anticipate and benefit from the concept of ecosystem services?
To answer the defined policy question the process of integration of both scientific and administrative phases was followed in parallel, addressing the challenge of a mapping and assessment of ecosystems condition and services in Karlovo. The scientific phase was initiated by the researchers and was based on compilation of available information and data from different projects (Nedkov et al., 2018; Yaneva et al., 2018; Dimitrov et al., 2018; Zhiyanski et al., 2017, MetEcosMap[1], TUNESinURB[2], ESMERALDA[3]) as well as of the results obtained from original research. It was agreed to focus on analyzing information about urban green infrastructure in Karlovo at local and regional scales in the context of ecosystem services provisioning. This phase started with the delineation of urban ecosystems following the national methodology (Zhiyanski et al., 2017), where the spatial representation of ecosystems and green spaces is based on integrated index of spatial structure (Nedkov et al., 2017). The identification and primary assessment of green infrastructure in Karlovo was realized and its phytosanitary status was assessed (Nedkov et al., 2017; Dimitrov et al., 2018). The assessment of ecosystem condition in urban ecosystems and green infrastructure of the city is measured by a set of indicators, which are organised in a system based on the concept of ecosystem integrity. Then the assessment of the key elements of green infrastructure condition in Karlovo was performed through an integrated application of in-situ observation and remote sensing using Unmanned Aerial Vehicle (UAV) technology (Dimitrov et al., 2018). The final step of the scientific phase was the assessment of selected ecosystem services provided by green infrastructure in Karlovo at local and regional levels. Together with the city administration the main policy questions were discussed and the following ecosystem services were outlined for further mapping and assessment. On “Urban” level the territorial spatial extent covers urban and peri-urban areas of Karlovo and the adjacent villages belonging to the Municipality. The selected ES Fragmentation and quality of UGI describes the ecosystem condition of the UGI unit. There was an option to analyse the Air quality regulation, but in the working process it became clear that there was not enough data for some of the indicators, which describe the levels of pollutants in the air and the fluxes between the UGI and the air, so this ES will be analysed in a next phase. As there is an intensification of the hazardous events and damages caused by floods, the assessment of the service Water flow maintenance and flood protection can provide valuable spatial information and estimates for the local authorities in terms of proper UGI managements and planning. However, the public records available are out-dated and the requirements to run the supporting model could not be met. On both local and municipal level, it was also possible to analyse the ES Carbon storage: Climate regulation. For the assessment of this service, the InVEST model was applied. Lastly, we implemented the ESTIMAP model in order to assess Pollination within forests and within agricultural lands for the territory of Karlovo Municipality. The choice of the relevant ES was made after discussions with city administration.
The administrative phase was realized in close cooperation with the local authorities and aimed at providing direct assistance in defining measures to improve the condition of green spaces and to undertake assessment and mapping of some ecosystem services in the spatial planning. Practical solutions for spatial development of green infrastructure and establishing a new research field station to study tree health status and contributions to public health and safety were recommended. Results of the assessment and mapping of the specific ecosystem services were presented to the local decision makers and this approach was considered as an efficient and effective tool for ecosystem services management in the city.
Researchers demonstrated the multifunctional green spaces management options through the co-learning processes and validation by the stakeholders (forest owners and managers; policy-makers). The city administration was informed how to ensure that green space is used efficiently for the benefit of the local economy and population as well as to protect the environment and to ensure effective multifunctional management of green infrastructure as well as the maintenance of ecosystem services of green spaces.
The collaboration between research and city resulted in realized advanced policy support around the question of green spaces allocation and their management to preserve and improve the provision of some ecosystem services. The key element of this process was ”adaptation”- the way how complex urban systems react to external perturbations, through a sequence of various reactions defining the resilience of the ecological and social components of those systems as a whole. Each and every of the social and ecological components of the management and governance system searches for keeping its own integrity and identity through accepting only changes that are not leading to a disintegration of the system which they are part of.
In Bulgaria most recently, the MAES initiative was introduced on a national level with the projects like TUNESinURB, IBBIS[4], ESMERALDA, and EnRoute[5]. The project MetEcosMap seeks to develop a national methodological framework to assess and to map ecosystem condition and ecosystem services. The Common International Classification of Ecosystem Services (CICES) V 4-3[6] was applied for the assessment of indicators for the delivery of final ecosystem services.
[1] Methodological Support for Ecosystem Services Mapping and Biophysical Valuation: https://eeagrants.org/project-portal/project/BG03-0026
[2]Towards better understanding of ecosystem services in urban environments:www.tunesinurb.org
[3] ESMERALDA: http://www.esmeralda-project.eu/
[4]Improving the Bulgarian Biodiversity Information System: https://eeagrants.org/project-portal/project/BG03-0001
[5]Enhancing Resilience of urban ecosystems through green infrastructure: https://www.oppla.eu/enroute
[6]CICES V4-3, European Environment Agency (EEA): https://cices.eu/
The assessment of the ecosystem services (ES) in the Karlovo City-Lab refers to a comprehensive choice of indicators relevant for the analysis of the most relevant benefits provided by the environment for the inhabitants in the municipality. The ES planned to be analysed and mapped are grouped in two sets according to the level of applicability for policy and decision-making (Table 1). The proposed indicators identify the ecosystem services referring to the ES category Regulation & maintenance from CICES V 4.3 and provided the opportunity to apply ES models/tools for the assessment of Carbon storage: Climate regulation and of Pollination. However, the ES classes and indicators needed to be adapted according to the in-situ urban environmental settings in terms of green infrastructure and some socio-economic aspects.
Table 1 List of ecosystem services and indicators assessed for Karlovo City-Lab
|
Policy level |
Ecosystem service |
Indicator |
|
Local (URBAN) |
Fragmentation and quality of UGI (incl. carbon storage capacity and local climate regulation) |
Soil sealing in GI Organic matter in soil Vegetation cover |
|
*Air quality regulation |
Annual dust emissions PM10 |
|
|
Water flow maintenance and flood protection |
Water holding capacity Vegetation cover Land cover pattern Integrated index of spatial structure |
|
|
Regional (MUNICIPAL) |
Global climate regulation by reduction of greenhouse gas concentrations |
Forest carbon stock (Organic matter in vegetation Organic matter in soil Vegetation cover Land cover pattern) (InVEST model) |
|
Pollination |
Floral availability (FA) Nesting suitability (ESTIMAP) |
*optional
On “Urban” level the territorial spatial extent covers urban and peri-urban areas of Karlovo city. The selected ES Fragmentation and quality of UGI (incl. carbon storage capacity and local climate regulation) describes the ecosystem condition of the UGI unit and its capacity to store carbon. The indicators refer to parameters about the structure and health status of UGI, such as land cover type, i.e. the ratio between the built-up territory and areas covered with impermeable material and the natural vegetation (soil sealing, spatial structure index); fragmentation of the GI unit area obtained by the urban fragmentation index.
Integrated index of spatial structure in urban ecosystems: it incorporates built types and land cover from the Local Climate Zones concept with urban ecosystem classes based on MAES typology. Semantically, it is composed of three elements that integrate ecosystem subtype code (J1–J10), build type code (11 classes representing build structure, e.g., compact high-rise, open low-rise, and sparsely built) and land cover code (7 classes, e.g., dense trees, scattered trees, low plants, and paved). An algorithm was developed for index generation using the urban ecosystems database and remote-sensing data. The index is used to define vegetation cover in urban ecosystems and assess their conditions as a part of the assessment framework. The identification of build types and land cover classes was based on orthophoto images and cadaster data (Nedkov et al., 2017).
The urban fragmentation index was derived from maps and satellite imagery. For urban areas this index is highly recommendable and supplements the analysis of the ecosystem service provision. It represents a set of fragmentation indices calculated by a variety of metrics to characterize landscape fragmentation using as input data CLC12 data in a vector format. By applying different remote sensing and GIS techniques, the NDVI was derived. The application of the NDVI index supplements the in-situ observations and existing data about the health status of the urban vegetation as it provides comprehensive information about the vitality of the vegetation cover. In recent study, Dimitrov et al. (2018) explain further the application of remote sensing techniques for Karlovo urban area.
The organic matter stock total t CO2eq/ha or t C/ha and the green infrastructure area [ha/capita] relate to regulating functions of the UGI relevant for climate regulation. The data from in-situ measurements as well as from the ICP Forest monitoring network for soil and aboveground tree vegetation was applied for the assessment. The relevant parameters as Total Organic Carbon [g/kg], Total Nitrogen [g/kg], bulk density of the soil were used to calculate the soil organic carbon (SOC) stock in urban green infrastructure as indicators for the provision of regulating ecosystem services at municipal level.
There is an option to analyse the Air quality regulation. The indicator includes estimations about the levels of pollutants in the air and describes the fluxes between the UGI and the air. The indicator can be assessed via annual dust emissions PM10 and calculations of the number of exceedances of the limit value for PM10.
Air PM10 concentration data: The municipalities of Plovdiv, Asenovgrad and Kuklen are included as an area where the levels of total dust, PM10, sulphur dioxide and cadmium exceed the established norms. Annual mean PM10 concentration [μg/m3] were obtained through the available national data from the Executive Environmental Agency (ExEA) and from the Regional inspectorate of Environment and Water, Ministry of environment and Water[i]. However, regular observations of PM10 concentrations for Karlovo Municipality are not available and are taking place on-demand by the Regional inspectorate. The permanent stations recording data for PM10 concentrations are available for the municipalities Plovdiv, Asenovgrad and Kuklen.
PM10 deposition: This indicator can be calculated according to the methodology presented by Fusando et al. (2017).
Leaf Area Index (LAI): mean LAI [m2/m2]. Due to the lack of available data for UGI the process of assessing the related ES is still ongoing.
The assessment of the ES Water flow maintenance and flood protection was of interest for the local authorities. The extent of the ES covers the watershed of Stara reka River and the analysis outspreads to the Central Balkan region. Therefore, indicators suggested in Table 1 and the data collection encompass observations on a larger spatial scale. The latter service is interlinked to the water flow and according to the objectives of the analysis and the peculiarities of the region, it is combined with the water cycle feature maintenance. The parameter used is the recorded number of floods, which caused damages in the last 10 years. For the identification of the urban ES and the UGI, the hydrological parameters represent the mean annual river discharge, estimated in mm/year and the groundwater discharge, estimated in l/s/km2. The present data for Karlovo Municipality is not available and the open-access records date from 1970. Therefore, the AGWA model could not be properly applied in order to generate results.
On “Municipal” level, the ecosystem services assessed for Karlovo city-lab are: Global climate regulation by reduction of greenhouse gas concentrations and Pollination. To assess and map the Climate regulation we used InVEST model and the relevant indicator Forest carbon stock. This is a complex indicator, where the current land cover (CORINE Land cover classes 2012 dataset) and biophysical table with Carbon pools (Soil organic carbon (SOC), t/ha estimations for Karlovo Municipality) represent the input data to run the model.
For the assessment of the capacity of the ecosystems in Karlovo Municipality to supply Pollination, the ESTIMAP tool was used to support mapping and modelling of that service. The provision of that service is described by the indicators Floral availability (FA) and Nesting suitability. We used the following input data for the territory of Karlovo Municipality in order to delineate the spatial polygons per component: i) For forest areas - CORINE Land cover classes 2012 dataset; ii) For agricultural areas - spatial data collected for agricultural parcels (vector data) derived by actual information, Ministry of Agriculture, Food and Forests.
In this analysis, we used the indicator Forest availability. Each forest type/crop type is characterized by specific value, which represents the potential of each vegetation type to provide nutritional resources for the pollinators. Later, these values were related to the corresponding land cover type in order to derive the Forest availability index. We consider territories of about 50 meters outside the forest as more prone to provide the service.
Table 2 Indicators and used methods to estimate the ecosystem services for the Karlovo City-Lab
|
Policy level |
Ecosystem service |
Indicator |
Method |
|
Local (URBAN) |
Fragmentation and quality of UGI (incl. carbon storage capacity and local climate regulation) |
Soil sealing in GI Organic matter in vegetation Organic matter in soil Vegetation cover |
Field observations; Laboratory observations; GIS and Remote sensing (NDVI) Calculating the carbon stock from national monitoring data |
|
Water flow maintenance and flood protection |
Water holding capacity Vegetation cover Land cover pattern |
DEM; Delineation of floodplains areas and flood risk zones; Hydrological monitoring data; Field observations; National statistics |
|
Regional (MUNICIPAL) |
Global climate regulation by reduction of greenhouse gas concentrations |
Organic matter in vegetation Organic matter in soil Vegetation cover Land cover pattern |
InVEST |
|
Pollination |
Floral availability (FA) Nesting suitability |
ESTIMAP |
6. Key results
Regional inspectorate Plovdiv (MOEW): [i]http://plovdiv.riosv.com/main.php?module=info&object=info&action=view&inf_id=30.
Local scale mapping
The map of green infrastructure (Figure 2) was prepared using the results of vegetation cover calculation. The vegetation cover for each polygon of the database was calculated using data about the land cover type from the integrated index of spatial structure and the average percentages calculated for main combinations of land cover classes (Nedkov et al., 2017).

Figure 2 Map of green infrastructure in Karlovo
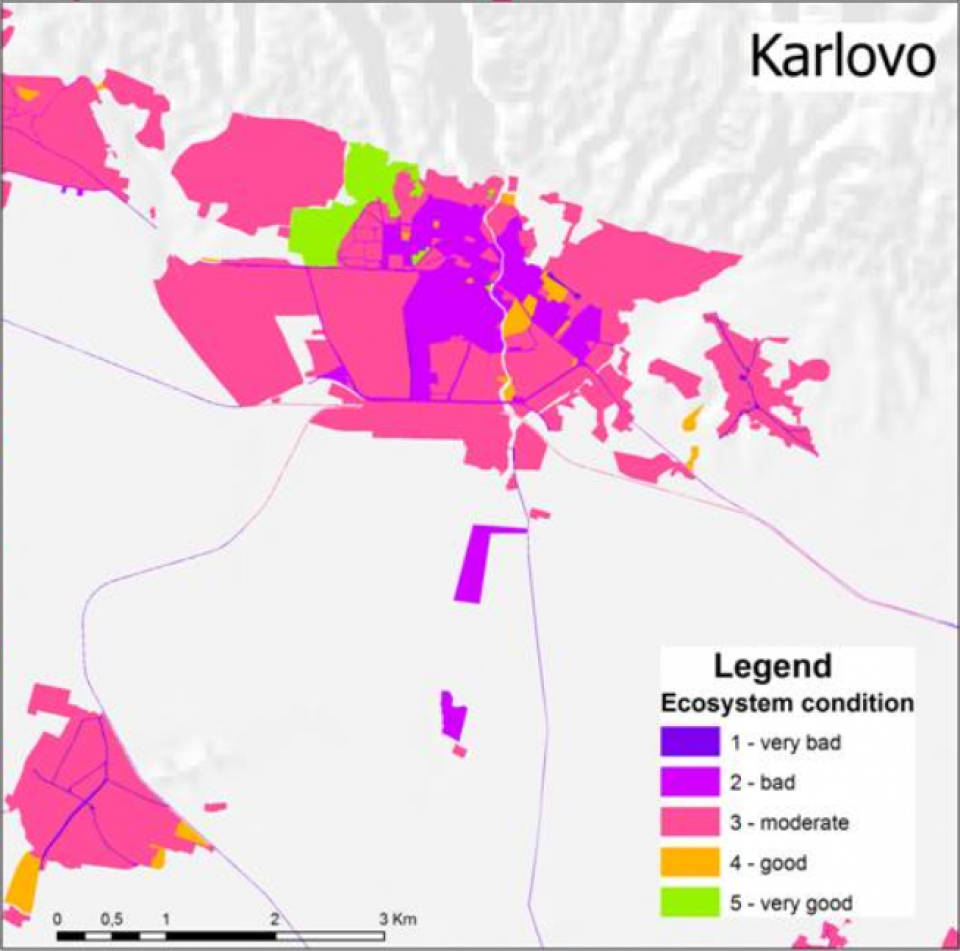
The condition of urban ecosystems measured by the integrated index of spatial structure represents a complex assessment of an ecosystem’s characteristics related to the spatial arrangements of built and land cover types in combination with particular ecosystem sub-type. The results for Karlovo show that most urban ecosystems are assessed as moderate (score 3) condition (Figure 3). However, the areas in the center of the city have mainly bad condition (score 2) and only few ecosystems have very good condition.

Figure 3 Map of ecosystem condition based on the index of spatial structure (Nedkov et al. 2017)
The global climate regulation ecosystem service is represented by the carbon storage capacity of urban ecosystems (Figure 4). The capacity classes are defined on a national scale basis using the amount of carbon per unit and the intervals are calculated using normal statistical distribution. The urban ecosystems in Karlovo have predominantly high (40% of the area) and moderate (37%) capacity while only 10% are with low capacity. The areas with low capacity are mainly in the neighborhoods located around the city center. Very high capacity is defined only in Apostolova gora park.
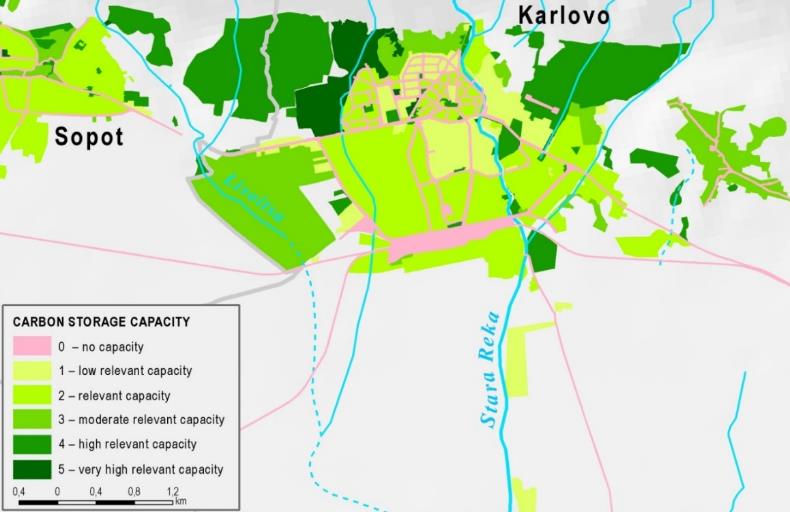
Figure 4 Map of carbon storage capacity in Karlovo (Nedkov et al. 2017)
The assessment of the capacity of urban ecosystems to regulate water flow and flood hazard is carried out by means of the proposed Index of capacity for water retention (ICWR), which is derived on the basis of a quantitative assessment of the three main retention indicators: Water holding capacity, Vegetation cover and Land cover patterns. The result show that the water retention capacity of the urban ecosystems in Karlovo is low to medium in J1 classes (Residential and public areas), J3 (Residential and public low-density areas) and J6 (Industrial areas) and high to very high in J5 (Urban green areas). The highest score is again in Apostolova gora park (Figure 5).
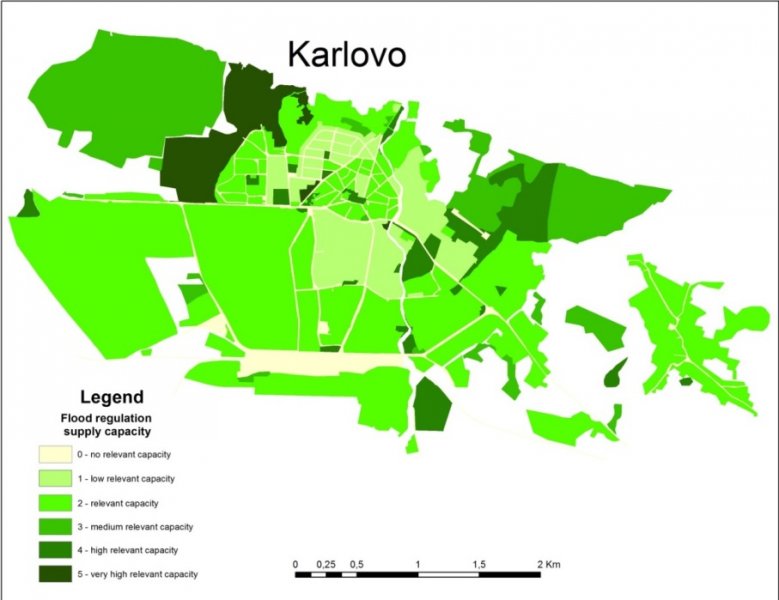
Figure 5 Map of flood regulation capacity of urban ecosystems in Karlovo (Nikolova and Nedkov, 2018)
Regional scale mapping and assessment
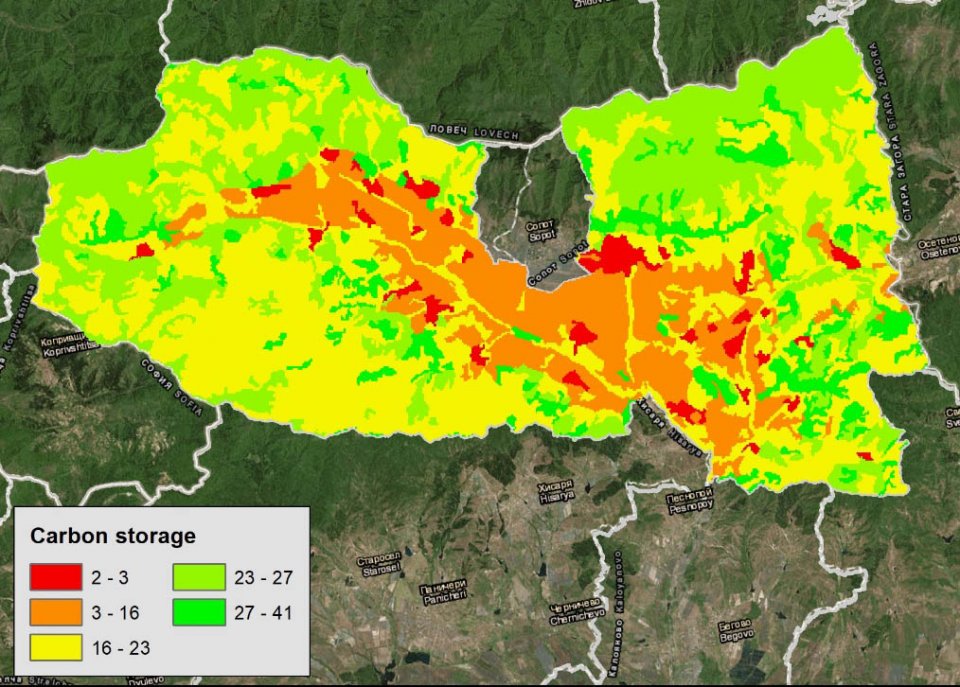
The global climate regulation ecosystem service is represented by the carbon storage capacity of urban and other types of ecosystems surrounding Karlovo city. The carbon storage capacity was estimated by modelling with InVEST (Figure 6).Most of the ecosystems in the studied region are characterized with medium capacity to store carbon. The role of peri-urban forests is well expressed.

Figure 6 Map of the capacity of the ecosystems to provide climate regulation for Karlovo Municipality - InVEST model
The results for pollination at this stage of the study are available only for floral availability indicator (Figure 7). The ESTIMAP model was applied for agricultural and forest ecosystems in Karlovo municipality. The model uses an expert based assessment of various types of land cover information to estimate the availability of floral resources (Zulian et al., 2014). The results show that the forests in the mountainous part of the municipality have low floral availability and respectively low pollination potential. The agricultural ecosystems in the lowlands have higher potential which varies from 0.05 to 1.1.
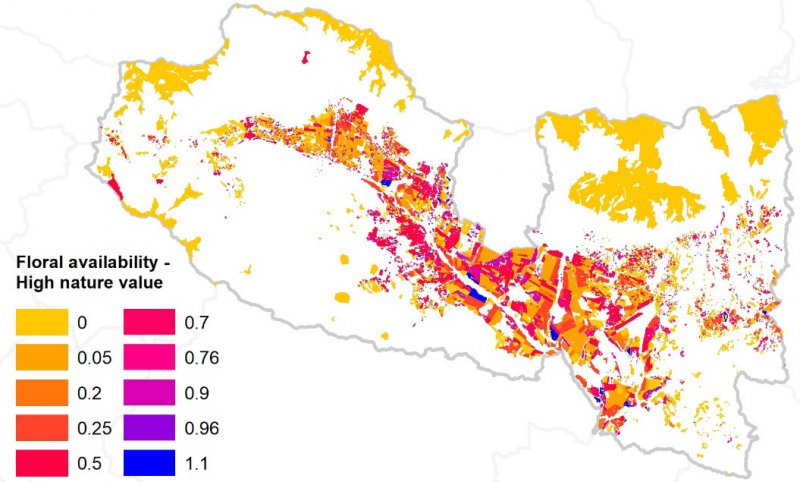
Figure 7 Map of the pollination capacity of Agriculture lands in Karlovo Municipality – ESTIMAP model
There are big expectations from Karlovo stakeholders (public actors, as local entities, but also private forest owners, managers and environmental NGOs), for a new style of governance and management able to take into account the environmental services provided by urban green spaces. Those are only supposed to be integrated at local and regional levels and through an approach starting from outside the urban area. This was the approach applied in Karlovo City-lab, based on mapping and assessment of urban ecosystems and ecosystem services to find the best way to integrate management of green infrastructure in spatial urban planning.
The mapping and assessment outcomes of the project are used as a new decision support tool for integrated green space allocation and management at the local and regional levels. The results served as a basis to promote adaptive forms of management and governance, whilst an inductive type of urban green space decision making is reported as one of the main products of the use of such instruments. This is justified by two reasons:
- The ways of management and governance (of urban green spaces) adapt over time (depending upon changes in the contextual factors) and space (because of the great variety of urban ecosystems concerned), in order to respond to emerging issues and problems, which are constantly evolving. Research can deal with such an evolution, and use the results of the project to support dynamic decision making.
- Adaptation is the way in which complex systems react to external perturbations, through a sequence of various reactions defining the resilience of the ecological and social components of those systems overall. Each and every of the social and ecological components of the management and governance system searches for keeping its own integrity and identity through accepting only changes that are not leading to a disintegration of the system they are part of.
The in-depth analysis of the urban ecosystems and green spaces dynamics within the landscape system as well as mapping and assessment of selected ecosystem services allowed identifying the drivers and barriers influencing adaptive green space management and governance. As a final result mapping and assessment of ecosystem services provided by urban and peri-urban green spaces was demonstrated and accepted as a policy support system and relevant decision support tools by the city authorities.
The importance of the urban green spaces as well as the associated implementation of innovative methods to assess urban green space are currently mainstreamed in urban planning across Europe. The development of sustainable practices through smart solutions is discussed at the local as well as the regional level of planning for both small and large-scale cities. The Karlovo city-lab provides suitable socio-economic and environmental characteristics that give appropriate information on the ecosystem condition and services.
The data derived by combining a set of methodologies and by integrating remote sensing methods with in-situ observations, give solid, up-to-date and comprehensive information about the health status of the urban green infrastructure. Therefore, the need to introduce and implement the ecosystem services concept into the municipal development plans and into the relevant policy for agriculture, forestry, climate change and strategies to mitigate the unfavourable impact of natural hazards, becomes evident and requires better communication and fostering of the scientifically based decisions for GI management across Europe.
The delineation of urban ecosystems in the town of Karlovo was part of a national scale mapping which was based on data available for the whole country. The extent of the urban ecosystems at the second level of MAES typology was outlined using the restored property plan database in Bulgaria which has some inaccuracies and mistakes especially in the land use definitions. Then, the resulting polygons were divided into ecosystem subtypes corresponding to the more detailed level 3 of the classification. This process necessitates detailed spatial data, which is not available as one single database; therefore different data sources were used. Each data source has its own accuracy and therefore the accuracy of resulting data depends on these sources.
The identification of the integrated index of spatial structure in urban ecosystems was performed on the basis of preliminary delineated polygons representing urban ecosystems. This predefined dominance of mixed land cover types as the polygons delineation did not take into account the character of the vegetation. The identification of built types, based on the principle of dominance, ignored the existence of some built types, which led to another source of uncertainty. For large-scale urban ecosystems mapping, it is better to perform ecosystems delineation and index identification in parallel, thus providing more precise results. A comparison of these results, with much more detailed mapping, will provide sufficient data for uncertainty analysis and further improvement of the approach.