Slideshow:

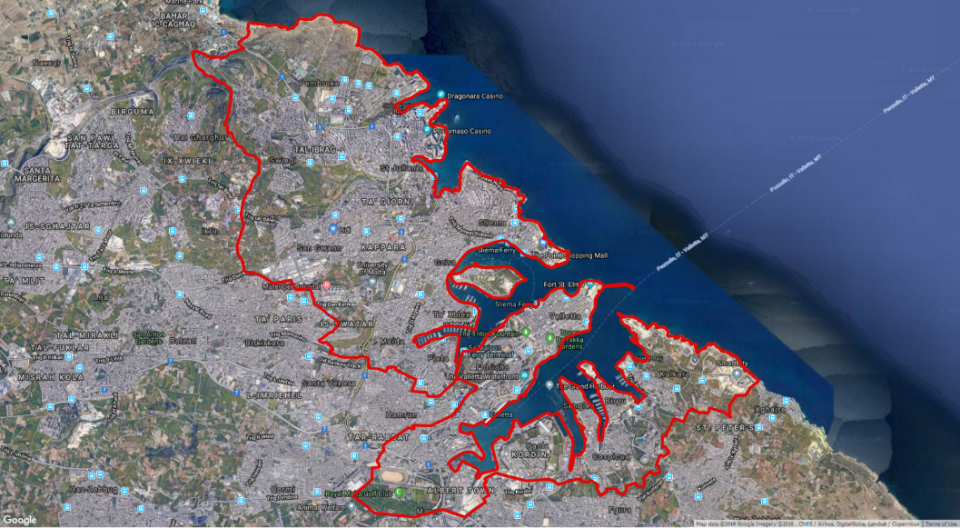

During the EnRoute project, an assessment of the green infrastructure and key urban ecosystem services was carried out for the city of Valletta and the surrounding urban area. For the EnRoute project, the Valletta case-study area is defined by the boundaries of Malta’s Northern Harbour and the Grand Harbour Local Plan areas. Urban land uses make a significant proportion of the case-study area (Figure 1).
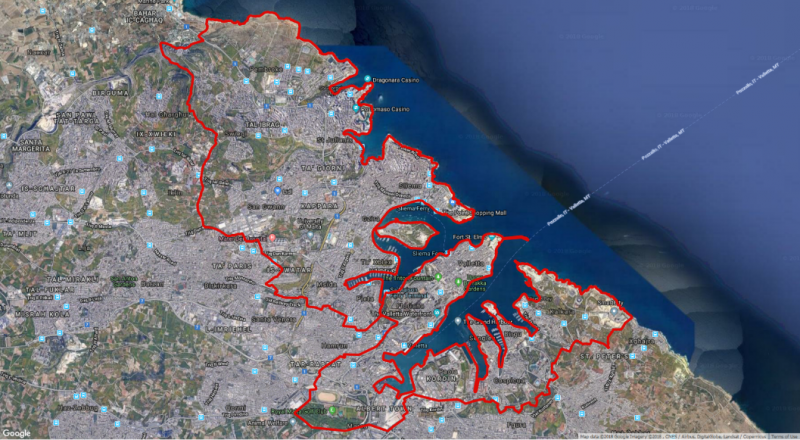
Figure 1 – The Valletta case-study area in EnRoute: Malta's Northern Harbour and Grand Harbour Local Plan Areas (basemap: Google, 2018).
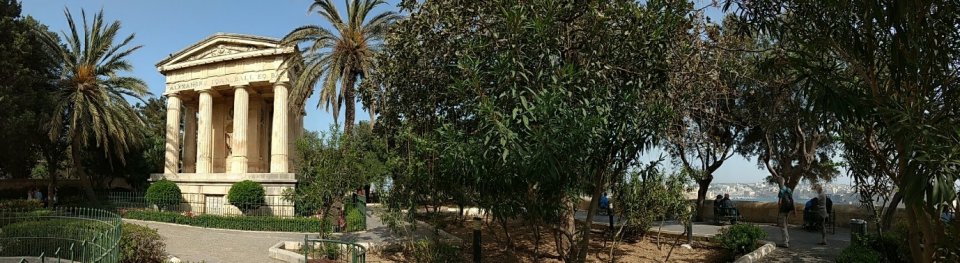
The historical capital city Valletta lies on the outer tip of a peninsula separating the Marsamxett Harbour and the Grand Harbour and is a UNESCO World Heritage site.
Figure 2 – Msida Bastion and Lower Barrakka historic urban gardens within the Valletta case-study area.
EnRoute policy questions
The mapping and assessment of ecosystem services in the national territory of member states is a key objective of The EU Biodiversity Strategy to 2020. This has created an opportunity to map and assess the role of ecosystems in providing key benefits to communities, the variation of these and the required policy and management responses to ensure human well-being. Malta represents an interesting case-study for ecosystem assessments, in particular because of the limited spatial extent and insularity, and the acting pressures, especially those arising from a high population density and a booming tourism industry which impact directly and indirectly on ecosystems and their services (Balzan and Debono, 2018; Balzan et al., 2018). The important role of ecosystems for the human well-being of communities is recognised by national policies. Malta’s National Biodiversity Strategy and Action Plan (NBSAP) recognises the need to develop the knowledge base about biodiversity and its value (Target 18), recognises the value of integrating biodiversity value in national policies, as well as decision-making and planning processes (Target 2), and aims to restore at least 15% of degraded ecosystems and for the essential services provided vulnerable ecosystems to be safeguarded (Target 13). Similarly, the Strategic Plan for Environment and Development (SPED, 2015) protects existing recreational areas to improve social cohesion, human health, air quality and biodiversity, and supports the strengthening of the existing ecological network. The development of green infrastructure is considered critical for sustainable growth economic by the National Green Economy Strategy (2015).
Against this context, the Valletta City Lab has at the onset of the EnRoute project identified two main policy questions and objectives (Table 1).
Table 1 – Policy questions and objectives of the Valletta EnRoute case-study.
|
|
Policy Question |
Which are the indicators that may be used to assess ecosystem services delivery by urban green infrastructure? |
|
Policy Objective |
To identify and implement key indicators that may be used to assess ecosystem services in urban areas, and which may be included in urban planning to support ecosystem-based management and promote human well-being. |
|
|
|
Policy Question |
How do ecosystem services vary spatially in the Valletta case-study urban area? |
|
Policy Objective |
To assess the spatial variation in ecosystem services and analyse how green infrastructure can contribute to support the national biodiversity strategy and the delivery of key benefits to the inhabitants of the case-study area. |
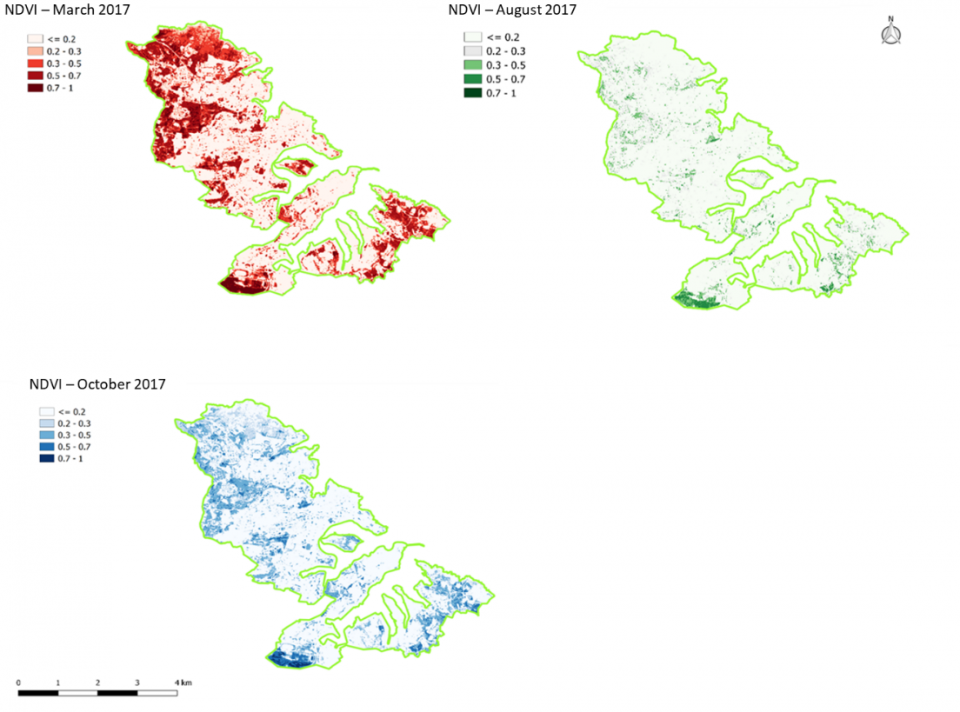
In order to identify green infrastructure within the area of study, Sentinel-2 satellite images were acquired during cloudless days for different seasons, namely March, August and October 2017, and Normalized Difference Vegetation Index (NDVI) values calculated for the study area (Figure 3). These raster maps were then used in combination vector maps of urban open spaces from the Northern Harbour Local Plan and the Grand Harbour Local Plan, and orthoimages from 2012 with a resolution of 15 cm, to map the different types of green infrastructure. The green infrastructure map was then revised using Google Earth images from 2017 to account for change in land uses and land cover. Subsequently, further information was obtained for each of the polygons to measure soil cover/sealing through visual estimates from ortophotos, and the soil class and area class category based on classifications in Zardo et al. (2017). Finally, canopy height and cover (canopy with > 2 m height) was calculated using the Digital Terrain Model (DTM) and (DSM) obtained from LIDAR data with a resolution of 1m.
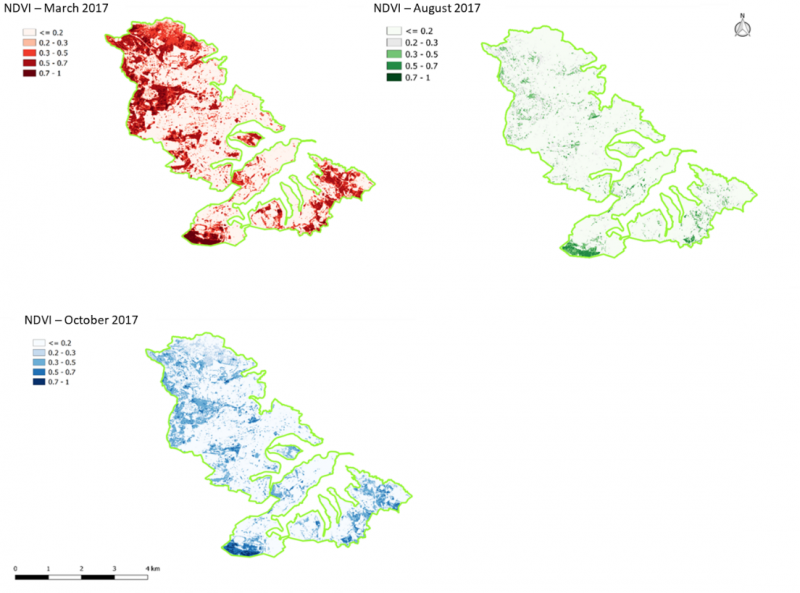
Figure 3 – Temporal variation in NDVI values for the study area obtained using Sentinel-2 satellite images.
The development of the case-study has been mainly research-led but it has benefited from planning and policy expertise. The case-study has built on previous knowledge and the limitations and recommendations identified in previous ecosystem service assessment and mapping case-studies within the study area and the Maltese Islands (e.g. Balzan and Debono, 2018; Balzan, 2017; Balzan et al., 2018). It was developed through a continued direct interaction between the research and planning partners of the EnRoute Valletta city-lab. Design of the case-study and the mapping of green infrastructure and data and spatial analysis for the mapping of ecosystem services were implemented by the research partner. The Planning Authority has provided the researcher with spatial environmental data, including local plan data and orthoimages and LIDAR data from 2012 (ERDF 156 data, 2013) , which was then used within the described methodology to map and assess green infrastructure and the associated ecosystem services. This interaction between planning and research has throughout the EnRoute project been extended to other stakeholders. Preliminary results from EnRoute have been presented to other national policy, business and civic society stakeholders together with results from other assessments of ecosystem services and relevant research initiatives relating to green infrastructure (e.g. ESMERALDA , ReNature ) carried out by the MCAST research team.
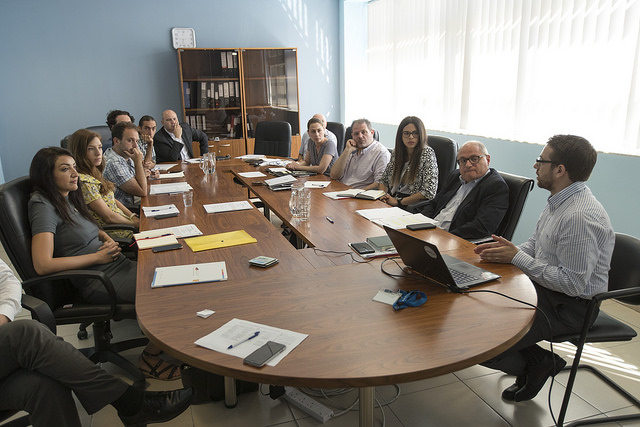
Figure 4 – EnRoute results discussed with policy, business, environmental organisations and other local stakeholders. The Applied Environmental Sciences Research Group of the MCAST Institute of Applied Sciences recently hosted a round table Discussion on the contributions of nature to human well-being.
The developed green infrastructure basemap was used in the assessment and mapping of key urban ecosystem services using established methodologies and indicators (Table 2).
Table 2 – Key indicators used for the assessment of ecosystem services
|
Ecosystem Service |
Indicator |
Description |
|
Cultivated Crops |
Agricultural land cover |
|
|
Air Quality Regulation |
Pollutant Deposition Velocity |
NO2 deposition velocity (Pistocchi et al., 2010) |
|
Carbon Storage |
Carbon storage per unit area |
Carbon storage per unit area (kgCm-2) (Nowak et al., 2013) |
|
Local Climate Regulation |
Cooling potential of green infrastructure |
Cooling capacity and expected temperature change (oC) (Zardo et al., 2017) |
|
Noise Reduction |
Noise attenuation |
Noise abatement for main roads and industrial areas (Derkzen et al., 2015) |
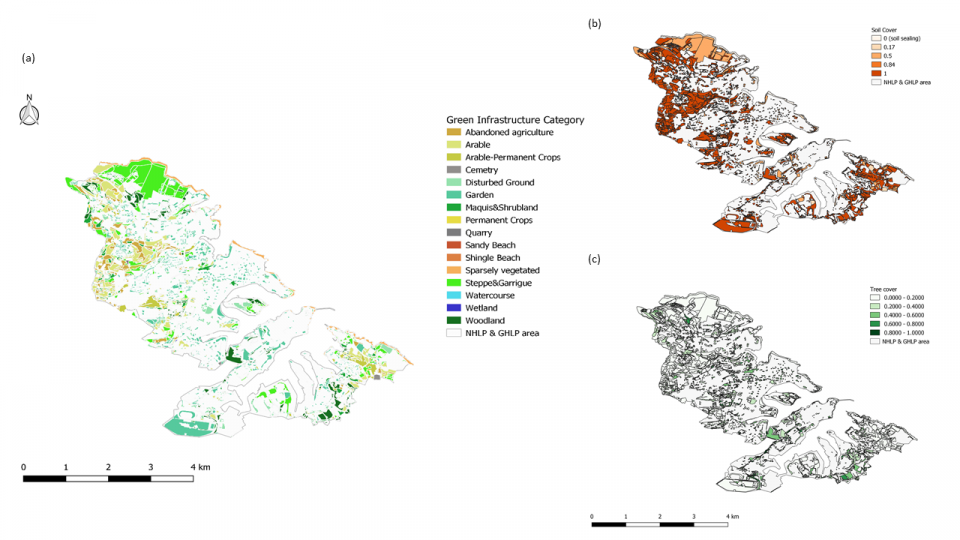
A green infrastructure map, showing the location of the main green infrastructure elements and categories, for the study area is shown in Figure 5a. This map indicates a lower availability of semi-natural and agricultural ecosystems in urban areas, where urban private and public gardens and landscaped spaces have a greater land cover. Green infrastructure elements covered a total surface area of 8.1 km2. The green infrastructure elements with the highest land area were steppe and garrigue habitats (23.2% of the total green infrastructure area), arable land (16.3%) and gardens and landscaped urban spaces (15.1%). The coastline provides a nearly continuous source of open space, mostly in the form of sparsely vegetated low rocky shores (4.8%), whilst a small number of shingle and sand beaches were also mapped. Green infrastructure elements were generally small, and the mapped green infrastructure polygons had an average area of 0.13 ± 0.7 ha. However, there were a few exceptions, as for example with the garrigue habitats in Pembroke, the golf course in Marsa, and agricultural green infrastructure categories in the valley systems within the study area (namely Wied Għomor and Wied Għollieqa) and in afforested and agricultural areas in urban periphery areas (e.g. in the Cottonera area).
Soil cover was mainly associated with agricultural and semi-natural green infrastructure elements, whilst gardens and landscaped elements were associated with lower soil cover (sports facilities had an average of 88.4 ± 27.4% soil cover; street landscaping: 77.6 ± 35.6% soil cover; public gardens: 50.9 ± 26.4% soil cover; private gardens: 35 ± 24.4% soil cover, measured through visual estimates for each polygon; Figure 5b). Tree canopy cover was highest in woodland areas (with an average cover of 40.4 ± 34.3%), gardens (31 ± 23.5%), wetlands (24.2 ± 21.5%) and shrubland (20.8 ± 36.3%; Figure 5c).
The mapped ecosystem services indicators for the study area are shown in Figure 6. Food provisioning ecosystem services, in the form of cultivated crops (Figure 6a), were mapped using orthoimages from the study area. Agricultural land uses are mainly on the periphery of the urban area. Most of the agricultural land cover (73.1% of agricultural green infrastructure categories, Figure 5a) was classified as arable, with the arable-permanent category being the second most important agricultural land cover (25.1%) followed.
The various green infrastructure categories ranked differently in terms of the assessed and mapped regulating ecosystem services (Figure 6b-e). This is a consequence of the high variation in surface area of the different categories, the biophysical characteristics of the green infrastructure, and in the case of noise reduction, the location of the green infrastructure within the study area. For the delivery of noise reduction ecosystem services, only polygons in areas with high noise levels (36.8% of the mapped green infrastructure within the study area) was considered as being important for noise abatement.
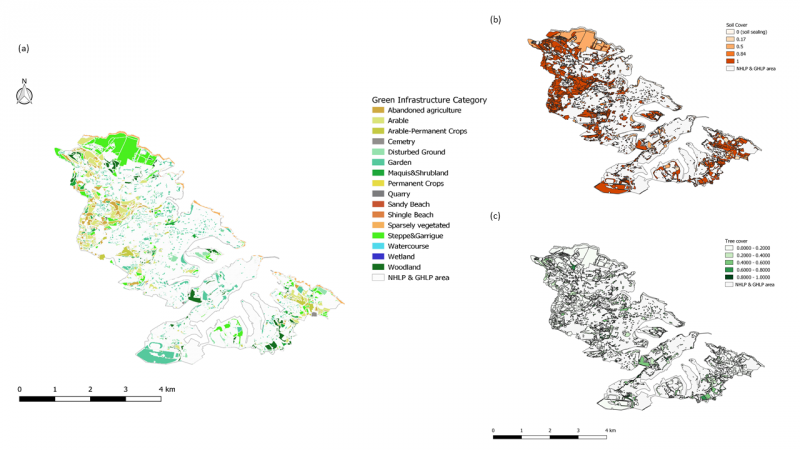
Figure 5: (a) Green infrastructure and (b) soil cover and (c) canopy cover maps for the study area.
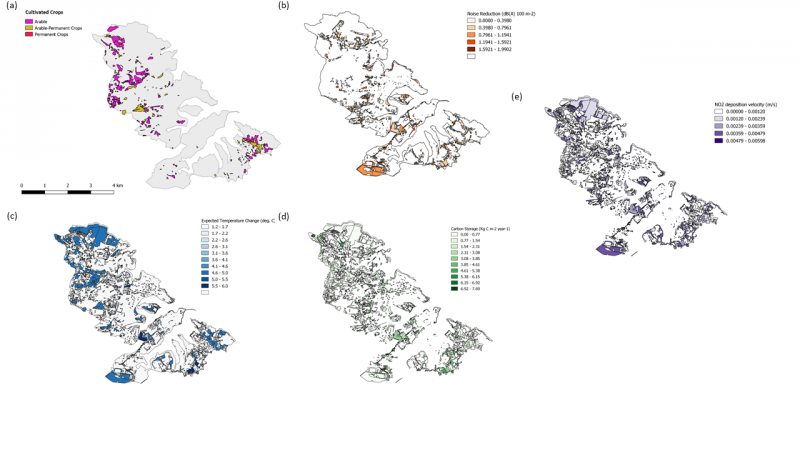
Figure 6 – Maps of (a) food provisioning, (b) noise reduction, (c) local climate regulation, (d) carbon storage and (e) air quality regulation ecosystem services from the study area.
Results obtained from this study provide an opportunity to map urban green infrastructure in the Valletta case-study area. In addition, the developed methodology allows for an assessment of ecosystem condition, based for example on soil cover and tree canopy cover proxies. Finally, these indicators were used in the mapping and assessment of ecosystem services. Given the densely populated nature of the study area, the development of a comprehensive understanding of the location, condition and type of urban green infrastructure is particularly important for urban planning. This may be considered as the first step towards an analysis of the contribution of green infrastructure to the well-being of local communities through the delivery of ecosystem services such as air quality regulation, space for recreation and climate mitigation and adaptation, etc. Hence, with an understanding that this network of green infrastructure can improve environmental conditions and citizens’ health and quality of life, as also identified by The EU Strategy on Green Infrastructure[1], development planning and landscape management can identify practices and measures that enhance green infrastructure for human well-being.
Results obtained from this study, complement previous observations from the study area (Balzan, 2017; Balzan et al., 2018), and demonstrate that green infrastructure is multifunctional and contributes to the supply of various ecosystem services leading to multiple benefits to human well-being. Different green infrastructure categories have been shown to contribute to the various regulating ecosystem services assessed in this case-study. Consequently, the lack of green infrastructure may be associated with the loss of these ecosystem services and benefits to local communities. Results obtained here can provide the evidence basis for enhancing the contribution of green infrastructure through the development of nature-based solutions according to the environmental conditions and ecosystem services demands and flows. These may include for example measures that promote the development of urban gardens for improve air quality or increased tree cover in areas with high noise levels for these to act as a noise buffer.
The EnRoute City Lab has created an important opportunity for collaboration between the scientific community working on ecosystem services assessment and planning practitioners. Through this collaboration we hope to enhance the science-policy interface leading to an improved implementation of ecosystem service concepts in urban planning and in the development of policy-relevant scientific analyses of the green infrastructure network within the study area.
During the EnRoute project it has been possible to develop a high-resolution map of urban green infrastructure and ecosystem services within the Valletta case-study area. These maps can play an important role in providing an awareness of the contribution of the different green infrastructure categories in providing benefits to human well-being, through food provisioning, noise reduction, air quality and local climate regulation, and carbon storage, and have implications for development and green infrastructure planning within the study area.
Further analysis is currently being carried out by the scientific partner through the collection of more complete datasets relating to green infrastructure and ecosystem services capacity, flow and demand within the study area. In addition, more detailed analysis of the spatial variation of green infrastructure and ecosystem services, and the variability of these with defined socio-economic parameters is also currently being implemented. The methods advanced in this study can be extended, used with data for different ecosystem services, and used to develop and implement planning policies that aim to achieve sustainability and improve human well-being.
Further information
Given that this case-study may be considered as a local assessment, and the small size of different land uses and land cover categories, limitations of recent ecosystem assessments within the study area were mainly associated with the availability of data at relevant spatial scales (Balzan et al., 2018). This has also been one of the potential limitations for this case-study that needed to be addressed. Spatial data relating to open spaces is normally incomplete. In this case-study, in order to counteract this possible limitation, green infrastructure was mapped using high resolution imagery. In most cases, it was possible to map the different green infrastructure categories with high accuracy. However, this was not possible for the watercourse green infrastructure category. Given that streams and freshwater ecosystems are ephemeral, it was not possible to map these using orthoimages or satellite photos. Consequently, the mapping of watercourses was based on existing maps of natural habitats for the study area. In the case of green infrastructure categories that are highly fragmented such as gardens, for which surface area and the degree of fragmentation may vary within the case-study area, only main green infrastructural elements have been mapped.
The ecosystem services mapping and assessment was implemented using spatial proxies that have been implemented in previous studies (Table 2). These were generally based on data obtained from literature reviews or field data. Consequently, the used methods are based on knowledge that has not been obtained from the study area, which may lead to sources of error that impact on the accuracy of this ecosystem service assessment. Another limitation is the availability of local data about ecosystem services that may be used to validate the assessment results. Further research is currently being implemented within the study area, by the research team at the MCAST Institute of Applied Sciences[1], to obtain fine scale datasets that include detailed information about the biophysical parameters defining green infrastructure, its condition, and the socio-economic parameters that influence ecosystem service demand and flow.