
Slideshow:


The Hague is a relatively green city in which green spaces make up to 17 % of the city's surface area. At the same time the city faces serious challenges with respect to public health and quality of life. Therefore The Hague aims to better understand the relation between green infrastructure and public health by combining socio-economic data with data on the greenery gathered through remote sensing. The two key questions are:
- Which set of socio-economic indicators can be identified as a reference marker for the impact of ecosystem services city-wide on human health?
- As more and more data and insights become available, which tools are useful to assess the impacts at local or district level? Useful means that they use objective data, apply proven techniques, and use hands-on procedures.
The original idea was to analyze inter-linkages between the city’s green infrastructure map, two ecosystem services (microclimate regulation using maps of urban heat island effect, and habitat provision using the nature value map), and a set of human health indicators. Comparing the 2014 situation to the 2018 situation might shed a light on the differences of public health development between areas with higher and lower amount of green infrastructure.
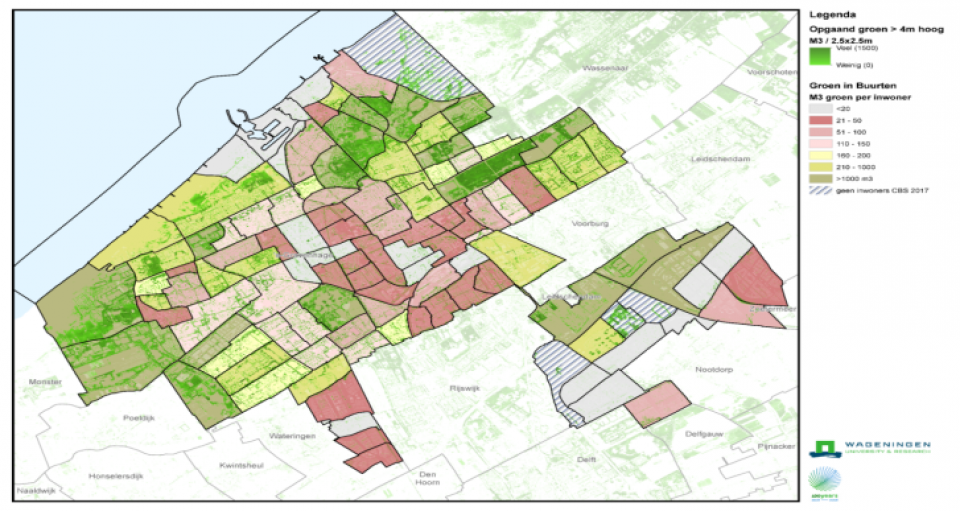
The first phase consisted of linking data on health indicators dating from 2014 Health Monitor to the green infrastructure map. It proved that the city’s green infrastructure map was not very suitable for analyzation purposes. Instead we used available lidar LIDAR data that provided a more detailed image on the amount of green infrastructure present in certain areas, in terms of tree volume per 2.5x2.5m. This data was transformed into a map showing the tree volume per inhabitant per neighborhood.
For the human health indicators, we selected the indicators that where available at neighborhood level from https://www.volksgezondheidenzorg.info/ and that could be considered proxies for the key indicators listed beforehand (see section 5). These indicators are:
- Percentage of neighborhood population that suffers from obesity
- Percentage of neighborhood population that suffers from moderate to severe anxiety disorder or depression
- Percentage of neighborhood population that suffers from one or more chronic diseases
- Percentage of neighborhood population that experiences a good health
- Percentage of neighborhood population that meets the exercise standard
- Percentage of neighborhood population that meets the fitness standard
These indicators are measured in 2012.
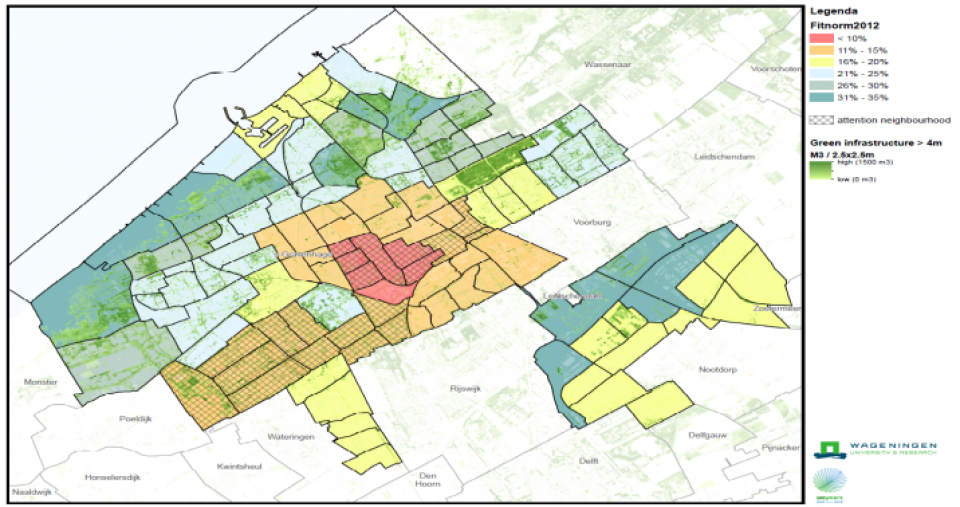
Subsequently, we analyzed the correlation between the tree volume per inhabitant and the set of human health indicators. Especially, the percentage of neighborhood population meeting the fitness standard appears to be well correlated with the tree volume per inhabitant.
The second phase consisted of linking data on health indicators dating from 2018 Health Monitor to the green infrastructure map. This proved to be very challenging as the data in the 2018 Health Monitor are not the same as in 2018. . We were unfortunately unable to gather data fit for comparing the 2014 situation to 2018 situation.
The availability and accessibility of data – especially on public health – is a critical factor. Due to privacy legislation health data are provided on a high level of aggregation. That makes is hard to link health effects to the presence of green infrastructure.
|
Indicator |
Spatial data layers |
|
Green infrastructure |
http://ddh.maps.arcgis.com/apps/webappviewer/index.html?id=ce1ad808ef1346d9a56b24cb5dda7e36 |
|
Urban heat island effect trends (data from 2014, 2018) |
https://www.ggdhaaglanden.nl/over/publicaties-en-onderzoeken/gezondheids... |
|
Nature value |
https://denhaag.raadsinformatie.nl/.../RIS296721_bijlage_1_Waardestellin...... |
|
BMI/obesity |
https://www.volksgezondheidenzorg.info/onderwerp/overgewicht/regionaal-i... |
|
Percentage of people suffering from hart malfunction, lung malfunction or depressions |
https://www.volksgezondheidenzorg.info/onderwerp/chronische-ziekten-en-m... |
|
Perceived quality of the daily environment |
https://www.ggdhaaglanden.nl/over/publicaties-en-onderzoeken/gezondheids... |
|
Sports participation |
https://denhaag.buurtmonitor.nl/jive?&lang=nl https://www.volksgezondheidenzorg.info/onderwerp/sport-en-bewegen/region... |
|
Perceived personal health |
https://www.volksgezondheidenzorg.info/onderwerp/ervaren-gezondheid/regi... |
|
Sales of medicine |
The approach of interlinking maps may prove useful in defining the correlation between human health and other spatial characteristics (such as urban density or presence of green infrastructure). We found some notable correlations between health and the presence of green infrastructure
Tools to assess the impacts at local or district level were not found during this project. There seems to be a gap between available data and a hands-on approach of ecosystem services.
Figure 1. Tree volume measured in m3/parcel (in increasing green colours) and in m3/inhabitant per neighbourhood in The Hague.

Figure 2. Fitnorm for inhabitants per neighbourhood (%) in relation to tree volume (m3/parcel).
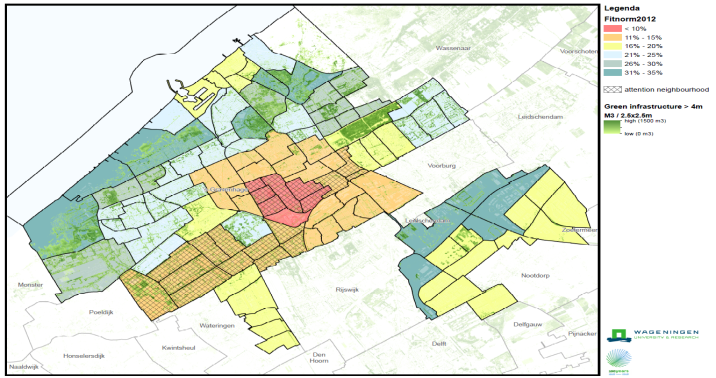
Figure 3. Percentage of inhabitants with obesity per neighbourhood (%) in relation to tree volume (m3/parcel).
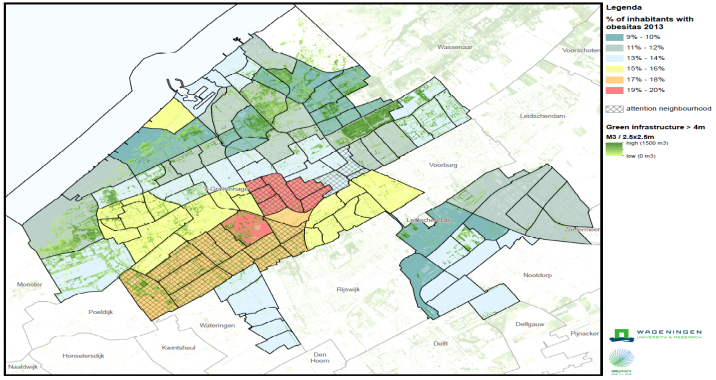
Figure 4. Relationships between tree volume per inhabitant and two heath indicators.
- Raise awareness on the correlation between human health and green infrastructure.
- Provide arguments for policy interventions.
- Define goals for funding green infrastructure e.g. investing in the quality of green spaces.
We found some notable correlations between health and the presence of green infrastructure. Especially, the percentage of the neighborhood population meeting the fitness standard appears to be well correlated with the tree volume per inhabitant. The availability and accessibility of data to a large extend define which data can be used as reference marker. Data at the desired level of aggregation prove hard to find.
Further information
Applying ecosystems services demands detailed maps, more profound methods and more extensive data sets which are usually not available for policy makers.
The availability and accessibility of data to a large extend define which data can be used as reference marker. Especially the level of aggregation is a limiting factor.