
Slideshow:


The Municipality of Lisbon covers an area of 8 km2 and has a population of 506,892 residents (and about 300,000 commuters). The metropolitan area is larger and has a total population of 2,821,697 inhabitants (data from 2011).
As strategy for sustainable land use the main policy issue in the Lisbon Municipality is to establish a coherent and interlinked urban green infrastructure (UGI) not only within the municipality but with the UGIs of the surrounding municipalities
The strong urban character of Lisbon a large forest park of Monsanto with 1000 ha and numerous others parks, gardens, street trees as well as the remnants of old farms, as well as the proximity of the city to the Tagus river estuary (the longest river in Iberian Peninsula), enable the occurrence of a relatively high diversity of ecosystems, and therefore an important flora and fauna.
Lisbon has a strong ethical responsibility for biodiversity, as one of the ratifying councils of the "Local Agenda 21" and as the host city of Lisbon’s Charter for sustainable cities (Lisbon Action Plan 1996). Because of that, Lisbon has the obligation to have a strategy of sustainable management.
In line with the objectives of the Convention on Biological Diversity (CBD), Lisbon is committed to protect native (or indigenous) biodiversity. But also the genetic heritage of the collections of exotic plants existing in numerous botanical gardens introduced in the landscape represent an added value to the city of Lisbon.
Within the framework of the United Nations declaration of the Decade for Biodiversity (2011-2020), and with the general aim of halting the loss of biodiversity, ensuring the resilience of ecosystems and the proper functioning of ecosystem services, the Lisbon Municipality, in partnership with Municipal Energy Agency - Environment - Lisbon E-Nova and the Institute of Nature Conservation and Biodiversity, and with support of the Faculty of Sciences of the University of Lisbon has set the goal of increasing Urban Biodiversity by 20% by 2020. In this sense, it was developed the characterization of the reference situation, in order to measure the target set for 2020
Indicators of biodiversity (sensu strictu) – Lisbon’s main ecotopes, habitats to fauna, ecotopes naturalness degree, connectivity at ground level, connectivity at canopy level, antropic connectivity , protected and classified areas
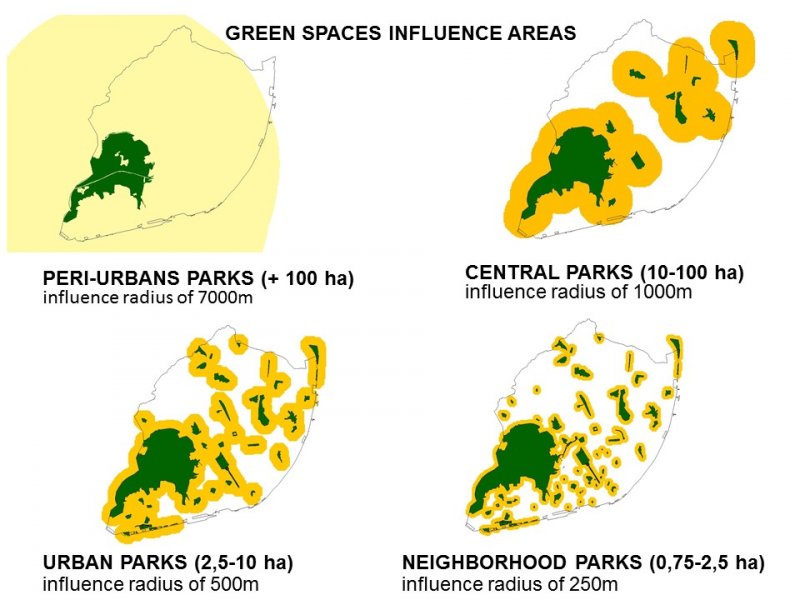
Indicators of ecosystems services: city permeable area, climate regulation by vegetation, people served by peri-urban parks of over 50 ha, by central parks of between 10 and 50 ha, by urban parks of between 2.5 and 10 ha, by neighborhood parks of between 0.75 and 2.5 ha and by all types of green spaces of over 0.75 ha
Indicators of biodiversity management and governance (not used in this analysis)
In 2010 the Municipality of Lisbon developed their CBI indicators with data from 2005-2010
A new evaluation in underway with data from 2015-2020 using the same methodology
For the Enroute project we use the most up-to-date data but provisional from 2015-2018
The anthropic connectivity could be considered as an ecosystem service however we consider to be more relevant as a spatial indicator of the connectivity and continuity of the green structure. Therefore its placement in biodiversity indicators . For the green spaces ecosystem services we used the influence areas from the different types of green spaces
City permeable area is the total area not impermeabilized in the city including green and brown areas and all areas where the rainwater has direct access to the subsoil
The biodiversity indicators used show a relative diversity in ecotopes in the city of Lisbon, despite being a heavily artificial zone
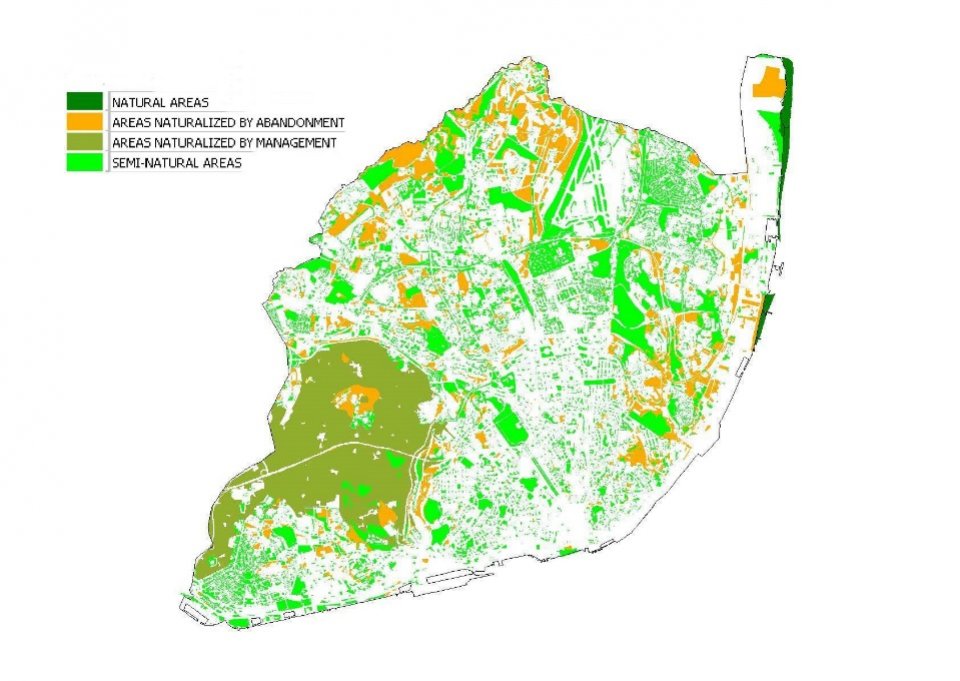
The natural spaces are very small (only salt marshes and mud flats can be considered as such) but a significant area of the city has areas naturalized by management in most cases trying to implement (reconstituting) the natural habitats
The biodiversity indicators were given particular attention to the connectivity that was evaluated under 3 different perspectives, connectivity at ground level relevant to terrestrial fauna based on the permeable areas of the city with a continuous dimension greater than 10 ha, connectivity at the level of the canopy for wildlife based on existing buffered forest areas of 20m with a continuous dimension greater than 10 ha and anthropic connectivity defined by the continuous structure of the green spaces and radius of influence of 300 m
As an indicator of biodiversity, the different types of environmental protection of the territory were also described
Regarding ecosystem services, it was considered as more relevant the special evaluation of areas without access to green spaces, and this evaluation was carried out by different types of green spaces and their respective radius of influence (varying from 250m for the functions of neighborhood parks, 500m for urban parks, 1000m for central parks and 7 km for peri-urban parks). These indicators are considered essential for city planning especially in future upgrades of the master plan
It was also considered important to delimit the permeable areas of the city given the main ecosystem services where a negative evolution is predicted given the continuous demand for spaces to urbanize
For the climatic regulation by the vegetation was used as indicator the area covered by the arboreal canopy
Regarding the indicators presented here, the data are sufficient and credible, however, within the Lisbon´s CBI certain indicators show serious deficiencies (in the case of the number of fauna species)
Comparing the data obtained in the evaluation of the Lisbon’s CBI in 2010 with the current data (from 2015 to 2018), it is concluded that:
In terms of naturalness, in addition to a reduction of mudflats (installation of a marina), there was an increase of 3.1% in naturalized areas by management and 12.1% in semi-natural areas, implying a reduction of 12.1% of the areas naturalized by abandonment
Concerned the spatial connectivity, the ground level connectivity was reduced by 1.6%, while the canopy level connectivity as increased by 5.4% and the anthropic connectivity as increased 6.3%
The protected areas maintains the 2010 legal status however proposals of a 88% more areas for protection increase are under evaluation
On the ecosystems services there is a reduction of 40 ha of permeable area in the city but in contrast the population served by the different types of green spaces has significantly increased in particular the one served by all types of green spaces (8%).

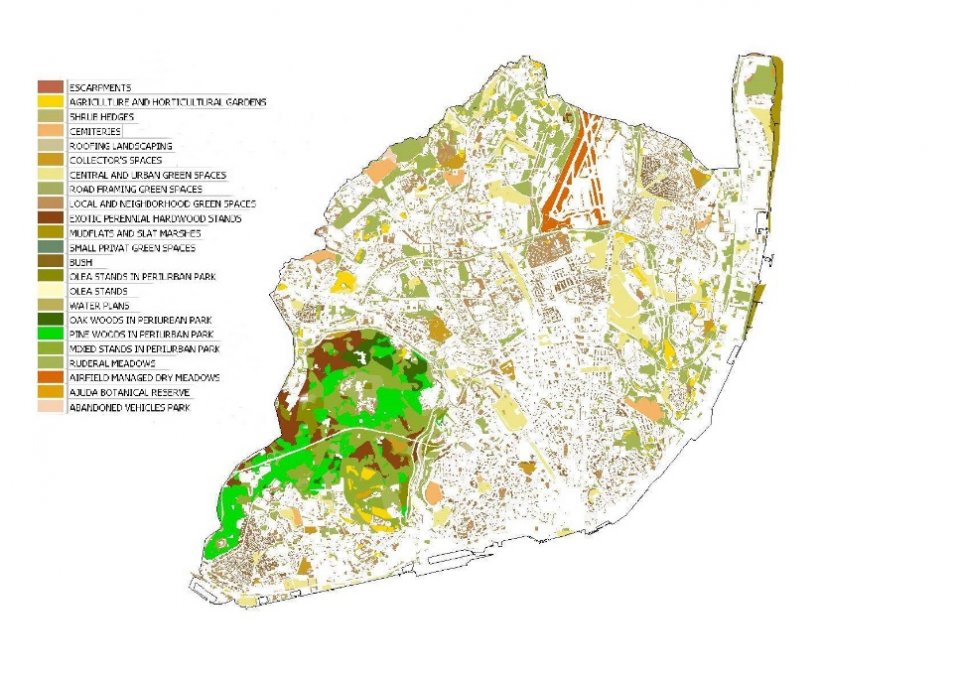
Ecotopes
|
ecotopes |
2018 |
|
escarpments |
1.6 ha |
|
agriculture and horticultural gardens |
119.3 ha |
|
shrub hedges |
3 ha |
|
cemeteries |
85 ha |
|
roofing landscaping |
10.9 ha |
|
collectors’ spaces – botanical and zoological gardens |
76.6 ha |
|
central and urban green spaces |
374.7 ha |
|
road framing green spaces |
86.8 ha |
|
local and neighbourhood green spaces |
598.6 ha |
|
mudflats and salt mashes |
52.6 ha |
|
small private green areas |
237.1 ha |
|
Olea stands |
12.4 ha |
|
water plans |
11.4 ha |
|
exotic perennial hardwood stands |
157 ha |
|
mixed stands in periurban parks |
327.4 ha |
|
oak woods in periurban parks |
58.9 ha |
|
pine woods in periurban parks |
314.2 ha |
|
airfield managed dry meadows |
89.7 ha |
|
ruderal meadows |
860.1 ah |
|
Ajuda Botanical Reserve |
3 ha |
|
abandoned vehicles park |
5.2 ha |
|
Olea stands in periurban parks |
50.5 ha |

Ecotopes naturalness degree
|
degree of naturalness |
2018 |
|
natural areas |
52.6 ha |
|
semi-natural areas |
1695.2 ha |
|
Areas naturalized by abandonment |
831.4 ha |
|
Areas naturalized by management |
948.8 ha |

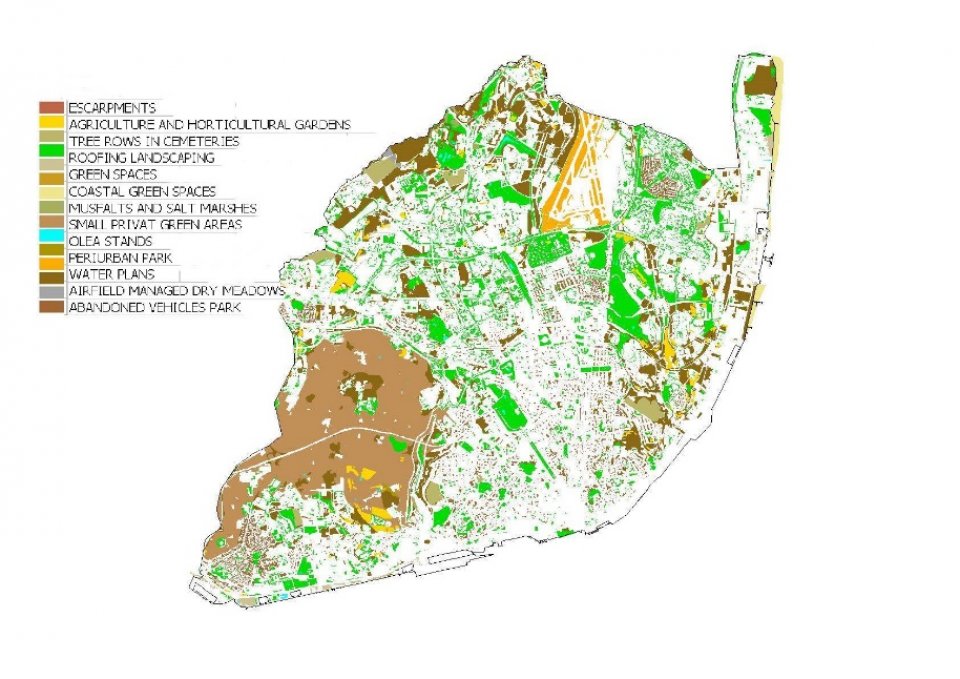
Habitats to fauna
|
fauna habitats |
2018 |
|
escarpments |
1.6 ha |
|
agriculture and horticultural gardens |
124.6 ha |
|
tree rows in cemeteries |
85 ha |
|
roofing landscaping |
10.9 ha |
|
green spaces |
1119.6 ha |
|
coastal green spaces |
27.1 ha |
|
mudflats and salt mashes |
52.6 ha |
|
small private green areas |
237.1 ha |
|
Olea stands |
12.4 ha |
|
periurban park |
912 ha |
|
water plans |
11.4 ha |
|
airfield managed dry meadows |
89.7 ha |
|
ruderal meadows |
860.1 ha |
|
abandoned vehicles park |
5.2 ha |
Connectivity

|
Ground level connectivity (2018) |
3535 ha (41,2%) |
|
Canopy level connectivity (2018) |
5574 há (64,9%) |
|
Anthropic connectivity (2018) |
5900.6 ha (68.7%) implying 331 029 inhabitants (59.98%) |
Protected aereas
|
forest legal regime |
1344.9 ha |
|
phytomonuments and buffer areas |
247.3 ha |
|
geomonuments |
9.4 ha |
|
phytomonuments with biodiversity values |
91.4 ha |
|
biodiversity values areas |
108.3 ha |
Indicators of environmental services
|
Permeable area (2018) |
3406.7 ha |
|
Tree canopy area (2018) for tree climate regulation |
1592 ha |
Green Spaces Influence Areas
|
Typology (2011-2017 data) |
population served |
percentage |
|
Periurban parks |
530732 |
96.20% |
|
Central parks |
358417 |
65% |
|
Urban parks |
308 188 |
55.90% |
|
Neighbourhood parks |
358 417 |
61.80% |
|
ALL KINDS OF PARKS |
224 727 |
40.70% |
Areas with shortage of green spaces
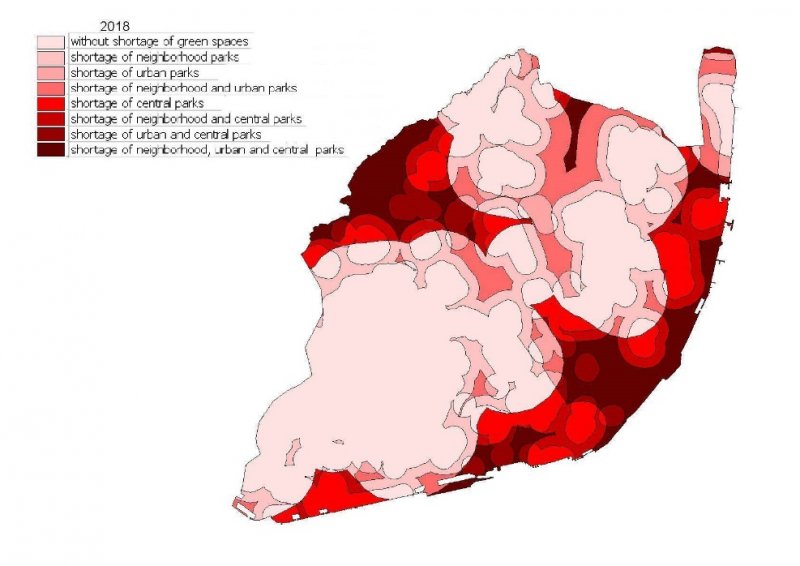
The results obtained through the biodiversity and ecosystems indicators evaluated in 2010 were included in the Lisbon's master plan of 2012, especially in relation to protected areas, anthropic connectivity and areas of lack of green spaces. These last two indicators were used in order to define the areas of future green spaces (non-consolidated green spaces)
Such indicators evaluated from 2015 onwards will make it possible to update the Lisbon's master plan especially in the protected areas that have been expanded with the introduction of the concept of areas of interest for biodiversity that determine the extension of protected areas of 2010 in 108 ha (88%)
The biodiversity and ecosystems indicators where the baseline to the Lisbon´s Biodiversity Local Action Plan
The FSC (Forest Stewardship Council) certificates the quality of the Lisbon Forest Park since 2016 while National Laboratory monitors the soil and water quality in several urban allotments gardens.
EnRoute has created an opportunity for collaboration between the scientific community working on biodiversity and ecosystem services assessment and planning practitioners. Through this collaboration it was possible to enhance the science-policy interface leading to an improved understanding.
Enhancing the ecological links of protected areas in Lisbon to the Metropolitan Area is a priority, especially by taking advantage of the "Tagus River Nature Reserve" (wetlands protected by RAMSAR and the Nature 2000 area, partly within the Lisbon borders).
Our data and modelling approach is based on remote sensing data and can therefore be applied to any city in Europe
Further information
The greatest difficulties derive from the acceptance of environmental data by the heads of the municipal master plan. This situation began to be reversed in the 1994 Lisbon’s Master Plan with an annex of environmental components, but only in the 2012 Lisbon’s Master Plan the data provided by the indicators of biodiversity and ecosystem services were integrate
This process necessitates detailed spatial data, which is not available in the municipal database
At present, the Lisbon’s municipality is developing a centralized database in order to integrate the data from biodiversity and ecosystem services.