Slideshow:


Poznań is a city with population of 482,000 permanent inhabitants (City Hall of Poznań, Department of Civil Affairs and Communication Permits, 2016) and area of 262 km2. Although it has a rich and well established green infrastructure that has been well preserved since 1930s their distribution is spatially diversified across the city. At the same time Poznań faces urbanization pressure on open or green spaces and is confronted with a depopulation process. Loss of inhabitants is particularly observed in the central districts characterized by a dense, built- up structure with limited availability of green and a high population density. Therefore the challenge is to improve the quality of space that contributes to the wellbeing of local population, which in turn may mitigate the process of depopulation. Regeneration of neglected areas through green infrastructure is understood as a nature-based solution that can help face contemporary challenges in demography and can contribute to strengthen urban resilience through creation the of more equally distributed green infrastructure. It is particularly challenging in densely built-up areas where open space is limited and green space patchy.
The policy questions behind the municipality activities in urban regeneration field realized under EnRoute Project focus on:
- systemic identification of areas with the lowest recreation ES capacity as places in need for transformation toward nature-based solutions;
- identification of priority areas for improvement that emerge from areas with the lowest ES capacity and the highest demand for recreational services expressed as the size of population that could benefit from new green spaces or facilities.
The workflow in the Poznań City Lab consisted of 4 main phases:
- Initial (preparatory) phase - included identification of the city's activities in which ES mapping and assessment can be useful; data collection from different sources, including database of City Information System (GEOPOZ 2017), Topographical Objects Database (BDOT, 2014) and digitization of objects; data transformation for analysis purposes.
- Analysis phase – consisted of a selection of Ecosystem Services and indicators applied in the MAES process and a selection of tools and methods for data analysis. This stage of work results in testing application of ESTIMAP recreation model (Zulian et al. 2013) that was adapted to the local scale and usage of GuidosToolbox (Voigt et al. 2017) for green infrastructure pattern assessment.
- Practical validation and application – based on preliminary results of Recreation Opportunity Spectrum map, potential areas for new green spaces were selected. The sites for future greening have been verified in the field. The field visits allowed for validation of selected areas and improvements of mapping methods. In the result a final list of possible new green spaces and recreation facilities scenarios was proposed. Green scenarios influencing the recreation ES and number of beneficiaries were calculated.
- Synthesis phase - project findings and conclusions were presented to the representatives of the Project Coordination and Urban Regeneration Office in Poznań City Hall as a proposal for further implementation.
There were 3 key issues crucial for the Poznań CityLab:
- Understanding how data availability and quality determine the detail of the analysis.
- Setting the model and analysis parameters as well as selecting classification method for results visualisation.
- Selecting potential sites for new green spaces, their validation in the field and selection of potential new green scenarios.
In the Poznań CityLab a researcher was leading the modelling and the analysis, including the procedure of setting the model parameters, the presentation of the results and the explanation of its limitations. The selection of location for new green spaces or facilities was done by both partners. The city partner was leading the validation of results during field visit being crucial for implementation of the results.
Scientific-practical exchange of experience leads to a better understanding of applicability of MAES for urban development. The collaboration between science and policy and the co-creation of results in the city lab proved to be essential for developing evidence-based decision making.
The list of indicators that were mapped and assessed for the city of Poznań includes:
Table 1. Ecosystem Services indicators
|
Ecosystem service/Theme |
Indicators |
|
Ecosystem conditions |
Population density at the urban units level [number/km2] |
|
Proportion of GI at the city scale and urban units scale [%] |
|
|
Proportion of arable land at the city scale and urban units scale [%] |
|
|
Proportion of protected areas at city scale and urban units scale [%] |
|
|
Fragmentation of urban green infrastructure [fragmentation metrics] including:
|
|
|
Ecosystem services nature-based recreation |
Recreation Potential [normalized score: 0 to 1] |
|
Number of beneficiaries of greening scenarios [number of permanent residents within a distance of 300m from areas of high recreation potential] |
Poznań is rich in green infrastructure. However its distribution across the city vary significantly (Fig.1).
The location of protected areas is highly linked with the green infrastructure distribution. Protected areas were identified in 22 from 42 urban units. The share of protected spaces ranges in municipality administrative units from 26% to less than 0.1%. In the municipality units targeted for urban regeneration only in Wilda 7% of areas is under nature conservation protection, while in three other urban units protected spaces are not present.
The spatial pattern of green structure influences fluxes of matter and energy. Both composition of green spaces and their configuration are also related to ecosystem services (Mitchell et al. 2015).
Table 2. Characteristics of green infrastructure patch size
|
Size class |
Objects |
Area [pixels] |
Share of all objects [%] |
Share of total area [%] |
|
class 1: below 2 ha |
1360 |
175485 |
83.69 |
4.00 |
|
class 2: 2-10 ha |
179 |
316988 |
11.02 |
7.22 |
|
class 3: 10-100 ha |
67 |
634088 |
4.12 |
14.45 |
|
class 4: above 100 ha |
19 |
3261706 |
1.17 |
74.33 |
|
Sum of all classes |
1625 |
4388267 |
100.00 |
100.00 |
The highest fragmentation of green spaces takes place in the Central-Western part of the city, where the smallest patches are located (Fig. 3) and distances between green spaces are the highest (Fig.4).
The spatial analysis of green and blue infrastructure, arable land and built-up area shows that in Poznań the availability of green spaces is rather high, but it differs strongly between different parts of the city. The share of green infrastructure varies from 4% in Stary Grunwald to 77% in Antoninek-Zieliniec-Kobylepole (Fig. 5).
Fig. 5 Distribution of main land cover types across the city.
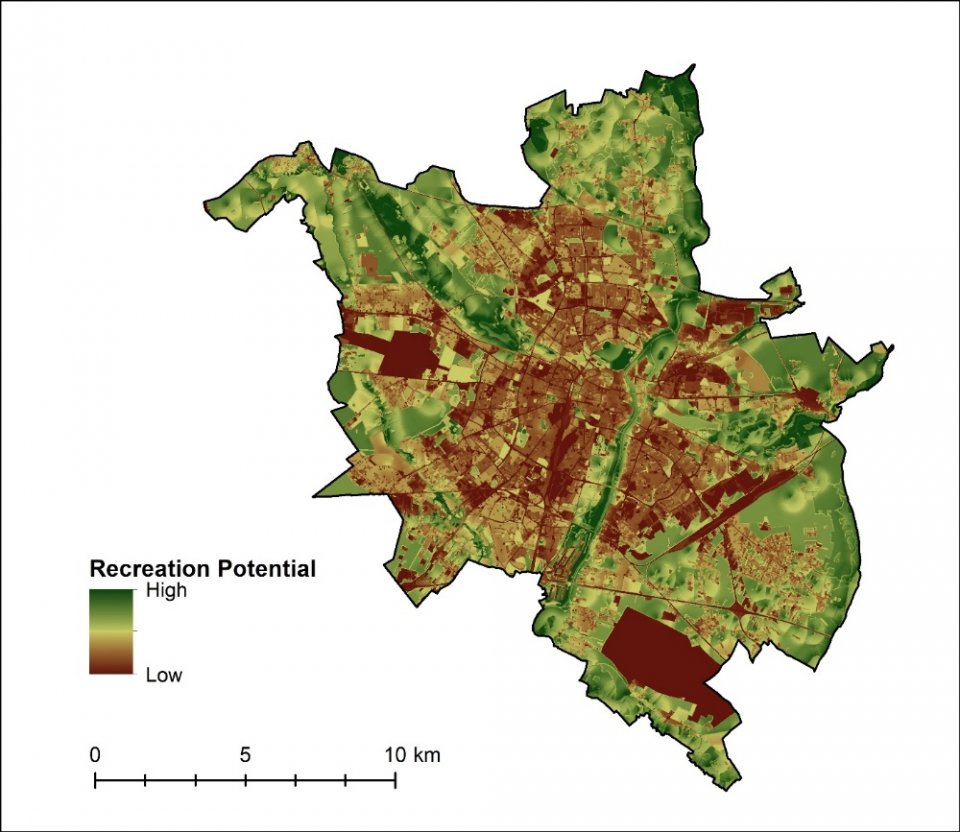
To improve the quality of life in the urban municipality units which have a low availability of green infrastructure, the Poznań City Lab assessed the Recreation Potential in the city. The Recreation Potential map (Fig. 6) takes into account following components: a) natural protected areas and natural monuments; b) green infrastructure; c) land use (outside green infrastructure; taking into account disturbances decreasing land use value for recreation purposes); d) surface water bodies and water courses.
Fig. 6 Recreation Potential in Poznań

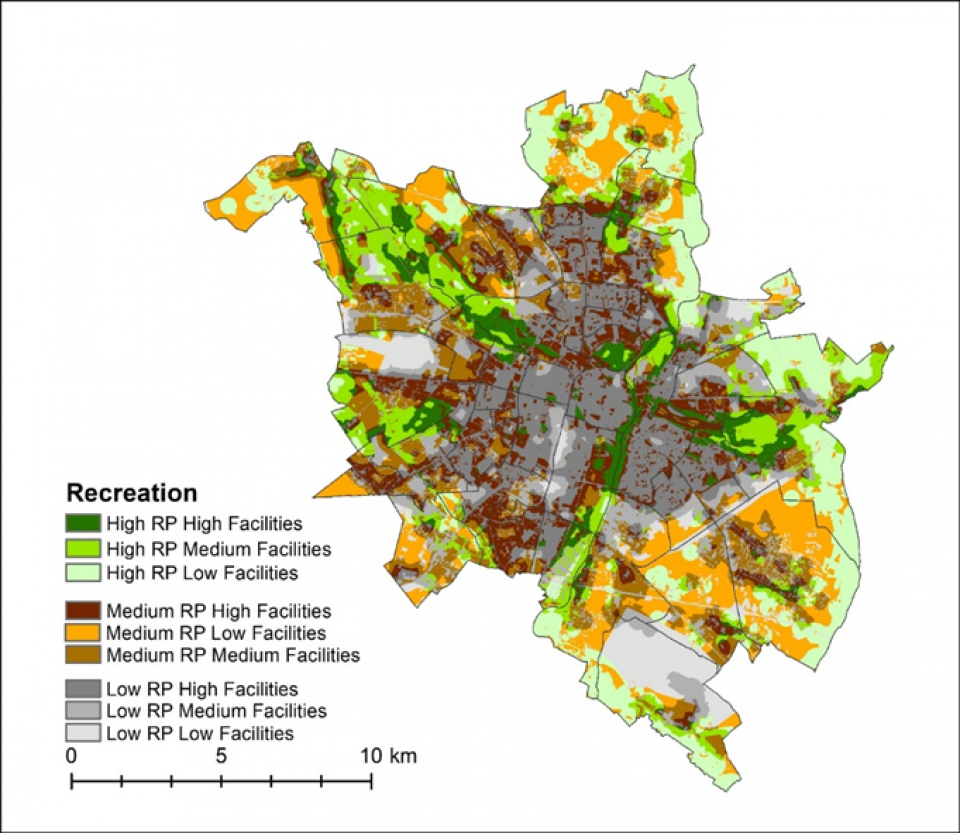
The Recreation Potential map was cross-tabulated with the Recreation Opportunity map, which includes presence of recreational infrastructure and transportation facilities to access recreation places. The Recreation Opportunity Map takes into account the existence of facilities to enjoy such as sport facilities, leisure facilities and additional amenities. It also includes public transportation stops, roads, pedestrian and bicycle paths that allow access to recreation sites. As a result, the Recreation Opportunity Spectrum map has been created (Fig. 7). It reflects the structure of green system in Poznań characterized by a high recreation potential of different recreational opportunities. The Southern-East and Northern outskirts of Poznań have visibly lower recreation opportunities. In contrast, a low recreation potential is visible in the central parts of Poznań characterized by a high density of urban built-up. At the same time, these are areas rich in recreational facilities. Low recreation potential accompanied by low level of facilities relates mostly to areas such as airports or industrial zones that are not predestinate for recreation.
Fig. 7 Recreation Opportunity Spectrum

Green regeneration scenarios and number of beneficiaries
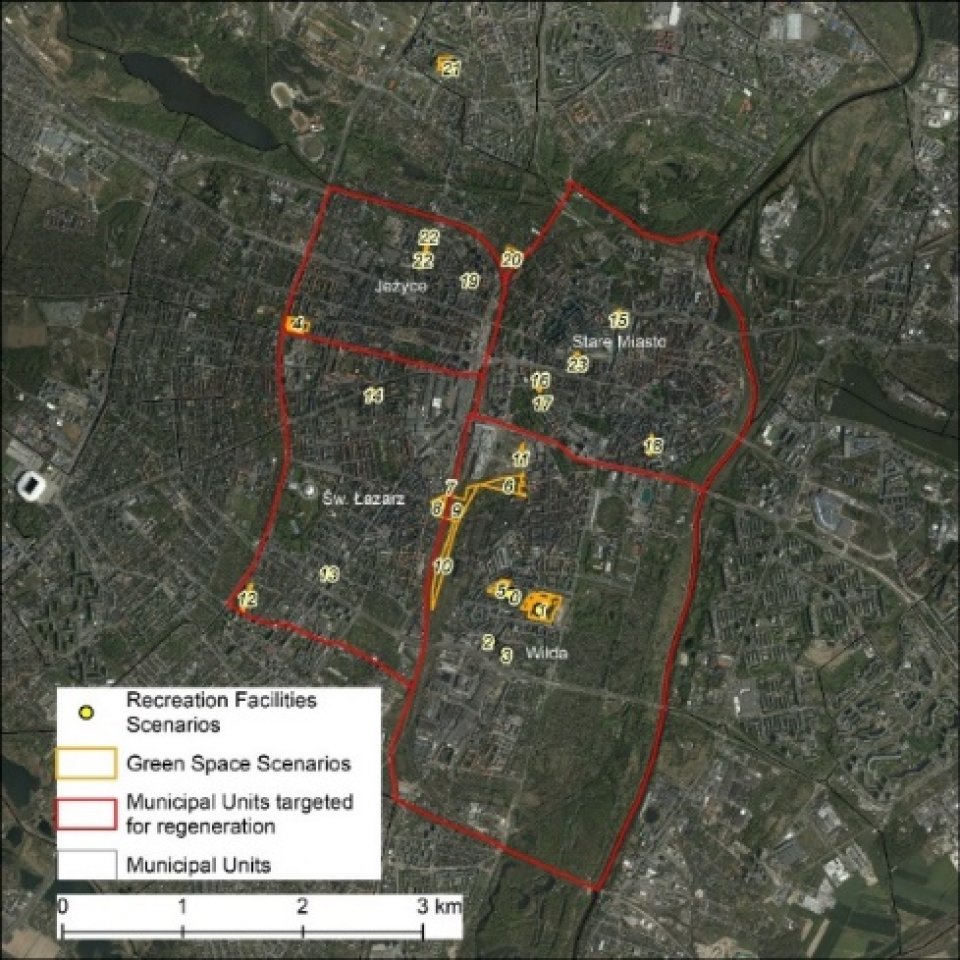
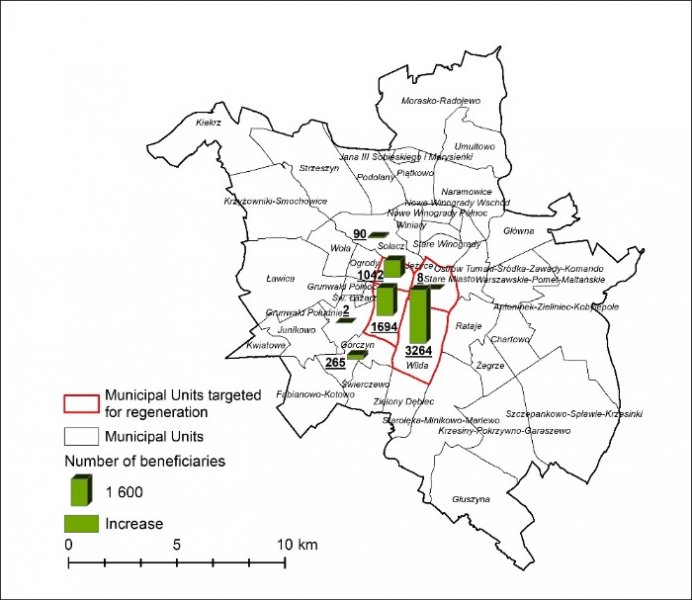
Based on the Recreation Opportunity Spectrum map, potential areas for greening under urban regeneration action have been initially identified and verified in the field (Fig. 8). To calculate number of the inhabitants potentially benefitting from new green spaces, the spatial distribution of green infrastructure elements as well as planning recommendations were considered (Grahn, Stigsdotter 2003; Nielsen, Hansen 2007; Coles, Bussey 2000; Grunewald et al. 2017; Zwierzchowska et al. 2018; Schipperijn et al., 2010). As a result the number of residents living within a distance of 300m from high recreation potential sites was calculated for actual situation and green regeneration scenarios. The results show that 46955 inhabitants live close to areas of high recreation potential and additional 6365 people could benefit from increased availability of green spaces which would have contributed to recreation potential (Fig. 9).
Fig. 8 Scenario for the location of new green space and recreation facilities
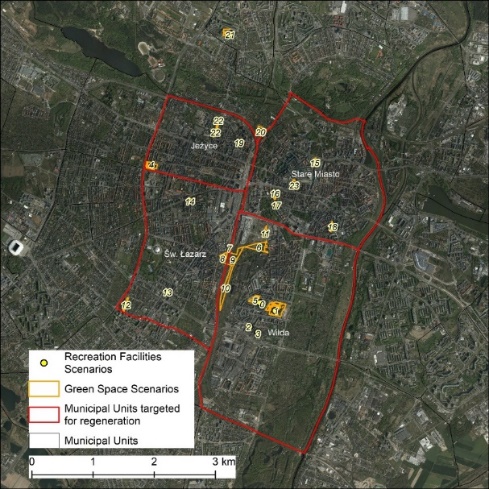
Fig. 9 Number of beneficiaries living within 300m from the areas of high recreation potential
Poznań's strategic goal to “improve the quality of life of all residents and the importance of Poznań internationally” is expressed in the Development Strategy for the City of Poznań 2020+ (DSW, 2017). ES mapping and assessment is particularly linked with two priority areas namely “Green, mobile city” and “Friendly residential estates”. The implementation of the “Green, mobile city” priority includes, among others, the creation of new green spaces, with particular attention to places with limited availability of greenery. The implementation of “Friendly residential estates” priority includes comprehensive revitalization towards high-quality public space with access to services, green areas, recreational and sport facilities. The comprehensive urban policy is realized through different programs and planning documents connected with Development Strategy. The spatial policy expressed in The study of conditions and directions of the spatial development of the city of Poznań highlights the need for preservation and enrichment of the greenery system (SCDSD, 2014). Specifically dedicated to urban regeneration issues is the Municipal Revitalization Program for the city of Poznań (MRP, 2017). One of the key challenges in Poznań highlighted in the urban policy documents is the improvement of the demographic situation of Poznań. Mitigating the depopulation process is also one of the goals of the Urban Regeneration Policy. The development of sports and recreation infrastructure and the revalorization of public green spaces are seen as a solution to increase the attractiveness of living spaces in the area of revitalization, improving health and strengthening social ties.
Against this background the assessment of Ecosystem Conditions and Recreation as ecosystem services created an opportunity to support the evaluation of current resources consisting of green infrastructure and recreation facilities contributing to ES capacity. Conducted simulations of greening scenarios showed how they improve the recreational ES capacity. In a situation of limited resources (financial and organizational) an evidence-based prioritization of actions can strengthen the efficiency of decision making. The EnRoute approach provided an opportunity to test the effectiveness of decisions by calculating the number of residents that will benefit in close proximity to areas of high recreation potential. The tool allowed therefore for targeting areas where the effect of improvement will be the highest.
The results of the green infrastructure fragmentation analysis and the assessment of ES capacity allows the planning of a more equal distribution of natural capital contributing to more resilient and justice urban development. The arguments resulting from the assessment can support the spatial planning process as well as revitalization actions.
- Cooperation between science and policy developed within the framework of Poznań CityLab showed both the usefulness of an ES approach and its limitations.
- The analysis of the distribution of green infrastructure allows for a better understanding of equality and justice in the availability of green spaces and recreational facilities for inhabitants.
- The analysis of the green infrastructure spatial pattern provides arguments supporting planning and implementation of connected system of green that benefit both people and nature in the city.
- The ES assessment provides evidence-based arguments for decision making, however for implementation purposes it needs to be combined with crucial information concerning for example land ownership, existing technical infrastructure etc.
- MAES has potential for monitoring urban development. For this purpose cities need to build spatially and thematically detail and up-to date database that will capture dynamic changes in urban structure and facilities.
- Assessment of the influence of new green space scenarios on number beneficiaries supports efficient resources management and problem-oriented decision making.
- The results of MAES have wider potential of application in urban policy. It could support health policy (green spaces and recreation facilities assessment) and social policy (green spaces conducive to tightening social bonds). The result could contribute to more community-oriented planning and implementation actions.
- MAES proved to have potential for supporting implementation of urban policy, therefore implementation of ES concept in the urban policy documents could facilitate sustainable urban development.
- The accessibility of certain data in the format applicable for GIS analysis was limited. Therefore data collection, digitalization and transformation was a time–consuming process.
- The temporal accuracy of the data is difficult to reach due to dynamic changes in the city.
- The thematic structure of data determines the delimitation of ES providing units. Within one land use/land cover type areas can be characterized by different features. An example are multifamily housing areas that may vary significantly in share of impervious and green spaces especially between housing estates located in the city center and more remote. In consequences recreation potential of more extensive multifamily residential areas can be underestimated.
- Land use or land cover and recreational facilities data based on which recreation opportunity spectrum is assessed do usually not include information about the quality of space and objects. Therefore the presence of features is the main criterion for mapping and assessment despite their different quality.
- The results of the ESTIMAP model to be practically used for selecting places for new green spaces or facilities, requires validation in the field.
- The ESTIMAP model and conducted spatial analysis are limited by spatial resolution and thematic structure of data. More accurate and detailed data would provide more information relevant for decision making.
- Models that rely on expert-based knowledge to some extent are burdened with subjectivity.