
Slideshow:
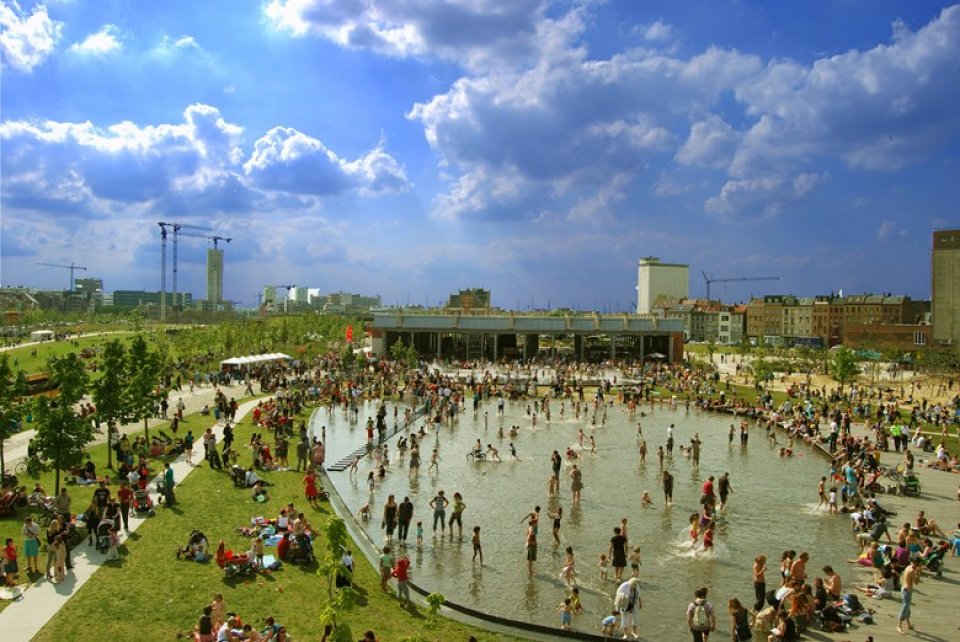
Antwerp is the second largest city in Belgium. It has 517 000 inhabitants and a surface of 204.5 km². The city is a mix of a highly urbanized central area, with a clear shortage of available green space, some larger important conservation areas at the borders of the city, and an industrial harbour area. Important challenges the city is faced with are flood risks both from tidal and pluvial floods, air quality and heat stress.
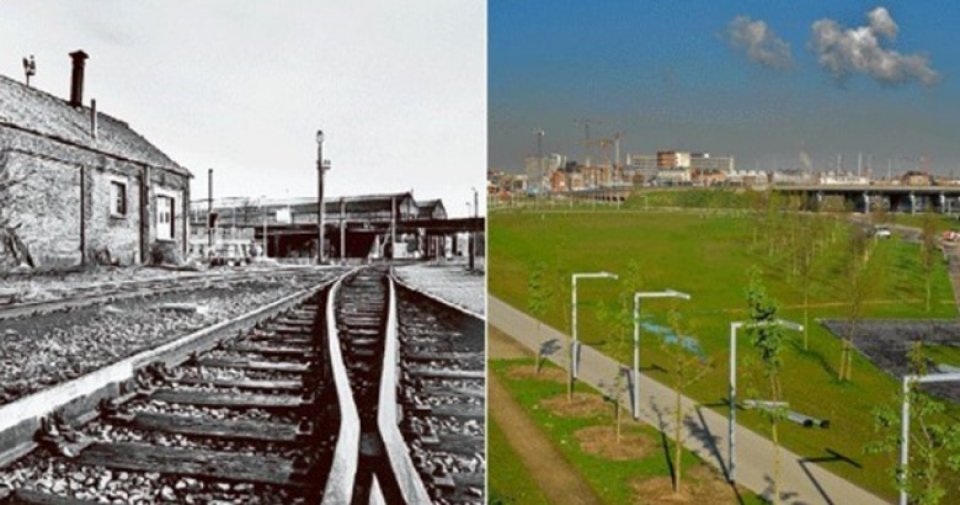
The city has the ambition to become greener. To achieve this purpose, a masterplan on green and blue infrastructure was developed, focusing on five “park-regions”. The master plan includes large-scale restoration projects (e.g. parkspoor Noord: transform former railway station to an urban park; park groot Schijn: restore a green-blue corridor and connect a large nature area to the city) and small-scale initiatives such as garden streets, green facades and urban farming. Beside this citywide strategic plan, nine local green plans at district level and one for the harbour area are currently under development or planned.
The key policy question that the city has with respect to urban green infrastructure is:
How to develop a city master plan green and blue infrastructure based on multi-functional ambition levels, supported by related maps and indicators?
A specific question specifically covered in Enroute is:
How to include private green spaces in the evaluation of the impact of urban green? How can we map the ecosystem condition of privately owned green areas (tree canopy, satellite images, …).
The city has the ambition to become greener. To achieve this purpose, a masterplan on green and blue infrastructure was developed, focusing on five “park-regions”. The master plan includes large-scale restoration projects and small-scale initiatives such as garden streets, green facades and urban farming. Beside this citywide strategic plan, nine local green plans at district level and one for the harbour area are currently under development or planned.
The MAES process started from a policy questions of the city of Antwerp:
- To inform about blue-green measures and (the effect on) environmental challenges
- To inspire the design process
- To quantify impact on a specific site
- To compare and combine measures
- To stimulate the dialogue between stakeholders
- To integrate blue-green infrastructure and challenges in the planning process
Mapping and assessing the impacts of green infrastructure helped achieve this. For this purpose, VITO together with the stakeholders within the city of Antwerp developed the Antwerp Greentool, which contains different ecosystem service maps and integrated assessment tools (see https://groentool.antwerpen.be/).
Based on the first practical applications, some issues were mentioned by different users. Specific issues covered within the Enroute project include:
- Scale-issues: existing maps have a 10 x 10m scale which is not detailed enough for planning in an urban context and makes it impossible to represent the presence and impact of small green elements such as hedges and small infiltration areas. More detail is needed.
- Information of private gardens is often missing in data layers although very important for biodiversity and ecosystem services in cities.
- A star diagram with scores is used to represent the impact, but selected measures often do not create a big shift in the result, which also makes the result less convincing. How can we better represent the impact of measures?
To set up a more detailed land use map, we collected reference datasets on land use and the presence of trees (tree database) from the city. We complemented these data with high resolution tree canopy data (satellite imagery) which are updated every 2 or 3 years.
A script was developed to combine all datasets to a new high resolution land use map tailored to the objectives of the city, which can be easily updated based on new reference datasets and the developed scripts in this project.
The resulting map is discussed with the end user and fine-tuned.
To answer the key policy questions we use existing indicators. This includes:
- Ecosystem condition: land cover map – tree inventory (proportions), biodiversity: key protected areas and corridors.
- Pressure indicators: air quality (NOx, PM10, PM2,5), noise hindrance (dB), urban heat (radiation temperature), flood risk of the sewage network, areas with a shortage of local green
- Ecosystem services: carbon sequestration (kgC/year), cooling capacity (°C), noise reduction capacity (dBA), improvement of the local air quality (%), water retention capacity, visibility and impact on housing value-recreation-health (score)
A new indicator which was developed:
- Presence of privately owned green space (condition indicators, presence yes/no)
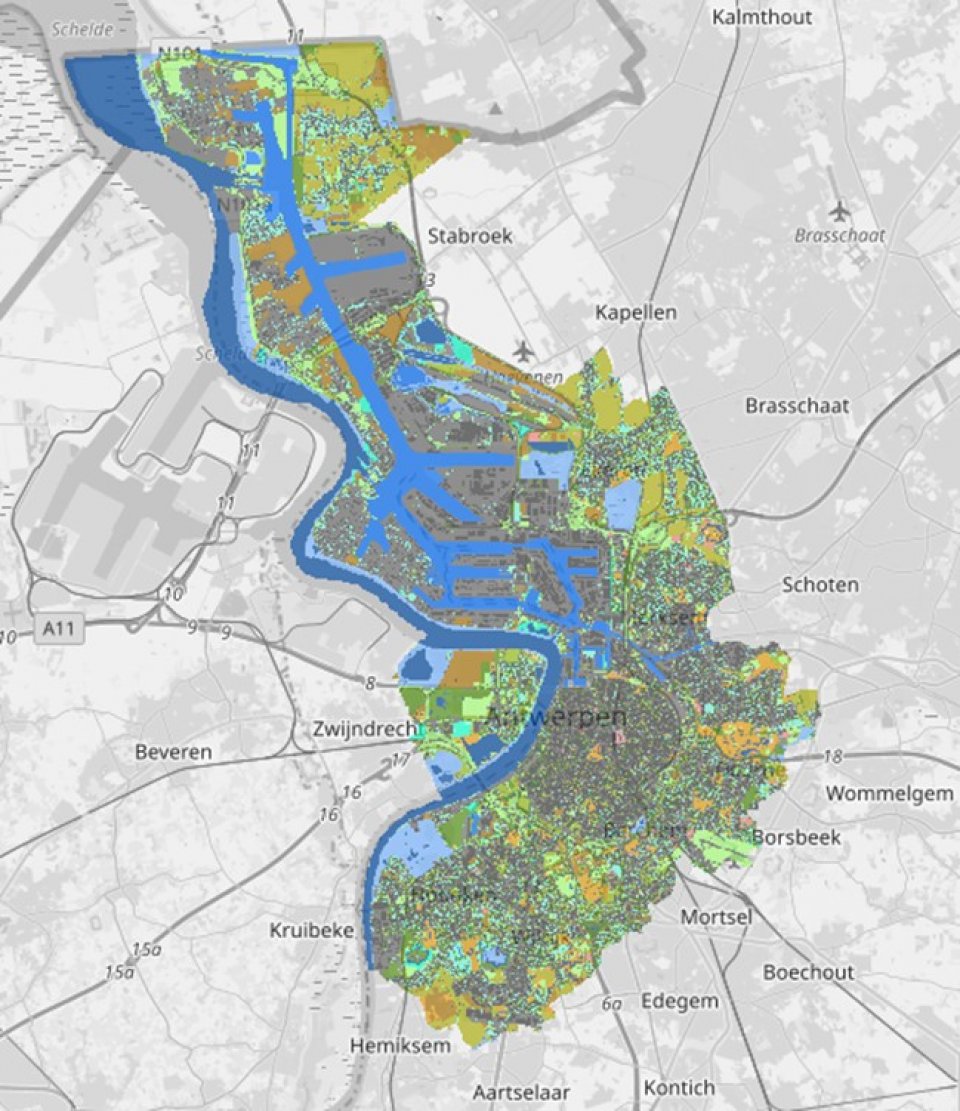
The key result is a new land use map at 1m resolution which is a combination of different layers and which can be used to take into account the presence of private green.
The figure below is an example output. Important aspects to mention are the ability to distinguish between different types of green elements (hedges, flower beds, coniferous/broadleaved trees in different height classes depending on the species, …). Specific green elements in the streets can also be seen.
Figure 1: High resolution land use map for the city of Antwerp. Grey are roads and black are buildings. Other colours are different types of green infrastructure elements.
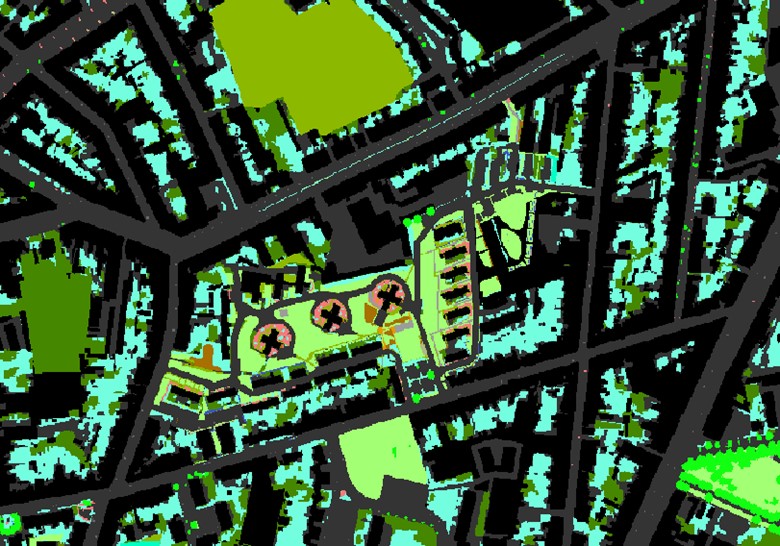
The figure below represents a specific square in Antwerp in the original land use map, an orthophoto and the newly developed land use map. Results demonstrate that the original land use map overestimates the presence of trees. The newly developed map is more accurate, but also slightly underestimates the presence of trees. The present trees were not taken up by the combination of layers which is an indication that further improvements can be made on the combination of layers. This is still work in progress.
The figure below represents a specific square in Antwerp in the original land use map, an orthophoto and the newly developed land use map. Results demonstrate that the original land use map overestimates the presence of trees. The newly developed map is more accurate, but also slightly underestimates the presence of trees. The present trees were not taken up by the combination of layers which is an indication that further improvements can be made on the combination of layers. This is still work in progress.
Figure 2: Antwerp green square (Groenplaats) according to original 10m resolution map, orthophoto, 1m resolution map. Dark grey square in left map are tree grates.
The map is a combination of the following layers:
- Building footprints (polygons) – Data layer available at national level – yearly updates
Link: http://www.geopunt.be/catalogus/datasetfolder/7C823055-7BBF-4D62-B55E-F85C30D53162
- Inventory of public green – Data layer available at city level – continuously updated
- Point locations trees
- Polygons of shrubs and grasses
- Polygons of forest
- Polygons of paving materials (porous materials)
- Line segments of hedges
- Polygons of water surfaces
Link: https://portaal-stadantwerpen.opendata.arcgis.com/datasets?q=groeninventaris
- Open Space – Data layer available at city level – continuously updated
- Polygons with information on open spaces (green, water, paving materials), larger scale than Inventory of public green
- Groenkaart Vlaanderen (green map Flanders): ortophoto map on green elements on 1metre resolution. – 3 yearly updates
Link: https://download.agiv.be/Producten/Detail?id=3966&title=Groenkaart_Vlaanderen_2012
- Land Use map Flanders – Data Layer available at national level
- Raster data at 10m resolution with land use and land cover information
The Antwerp greentool was used in a number of cases:
- Planning project greening public space “Groenplaats”: launch a call for tender for architects taking into account heat stress.
- C-creation of climate robust neighborhood Sint-Andries: help inform local residents on existing problems and how green infrastructure can help.
- Identifying priority public buildings for greening based on impact these measures have.
- Permits for parking on front garden: compare permit requests with presence of water sensitive areas and heat stress.
Its relevance for specific applications such as local greenplans is still to be proven.
The Antwerp greentool is a nice example on how mapping and assessment of ecosystem services in an urban context can help urban planners, administrations and citizens to make more targeted decisions regarding the location of green infrastructure.
Higher resolution datasets are required to be of use in specific contexts and to take into account the importance of privately owned green. The Enroute project gave the opportunity to test and demonstrate the added value of high resolution (1 meter scale) data.
Further steps on how to use and integrate these data for impact assessments still need to be performed.
Further information
The map we developed is an important improvement compared to the 10 m resolution map previously used. Some assumptions were made to combine the different layers which could lead to misclassifications. Examples include the width of tree crowns to match point data on tree types with tree canopy information and a reclassification of the different typologies to a common and more generalistic typology.
Besides, some methodological issues cannot be resolved by a one dimensional raster map such as pave surfaces underneath street trees and the representation of green walls.