Images


Organisations:
Dieter Rink and Ellen Banzhaf (UFZ Leipzig, Department of Urban and Environmental Sociology)
Helen Kollai (UFZ Leipzig, Department of Bioenergy)
Torsten Wilke (City of Leipzig, Department of Urban Green Areas and Watercourses)
Sanja Fistric (City of Leipzig, Department of Environmental Protection)
Policy challenge(s)/questions:
Leipzig is a growing city with green ambitions. It is one of Germany's greenest cities with an average of 254 m² green space per inhabitant. Leipzig is highly dynamic, so how can the city maintain or even enhance ecosystem services of green and blue infrastructure under the conditions of urban growth, land use pressure and recompaction? To better understand where urban green infrastructure is under pressure, the Leipzig EnRoute city lab mapped the presence of urban green space at high resolution and combined it with detailed population statistics. The mapping exercise provided an indispensable building block for the Green Master Plan, which is currently being prepared. An important lesson is that mapping should be combined with in situ green space monitoring of, for example, vegetation biomass. This would add value to remote sensing data and improve the capacity to assess ecosystem services provided by urban green space such as carbon dioxide removal. In addition, data were only available for 2012. An account based on time series of land cover and land use would help city planners to better understand to what extent urban green infrastructure is under pressure.
Due to shrinkage and deindustrialization in the 1990s, Leipzig had a large number of brownfields in most parts of the city (commercial brownfields covering an area of 517 ha in 2012; Banzhaf et.al. 2018a). In the course of the urban restructuring, new green spaces were created from it in the early 2000s: local district parks (Rabet, Lene-Voigt-Parc, Henrietten Parc), urban forests (Stadtgärtnerei-Holz, Schönauer Holz, Bürgerbahnhof Plagwitz), urban gardening projects and the Parkbogen Ost (a park band for Leipzig East) were developed. In addition, over 200 green interim uses were established on brownfields (Rink/Behne 2017). During that era, Leipzig pursued the guiding principle of "more green, less density" in its planning. The dynamic growth observed since the 2010s has led to additional land take for housing, social and technical infrastructure and commerce. Initially, many smaller brownfields were clustered and reused, but meanwhile complete new city districts are being planned or developed for several thousand inhabitants each on larger brownfield sites (Lindenauer Port, Eutritzscher Goods Station, Bavarian Station).
The city's new master plan now follows the model of "double inner development" (City of Leipzig 2018). Due to the higher number of inhabitants, an increased intensity of use on all green spaces, especially public green spaces such as parks, can be observed. In addition, change has taken place in the open space behaviour of youth groups which is reflected in an increase in active forms of use and events. The consequences are overuse of green spaces as well as different conflicts of use. The city administration in Leipzig is currently endeavouring to regulate the pressure of use and to preserve green spaces. Furthermore, ecosystem services, in particular local recreation, are to be further qualified. Regarding green infrastructure the decisive question is therefore:
How can the City of Leipzig maintain or even enhance ecosystem services of green and blue infrastructure under the conditions of dynamic urban growth, land use pressure and recompaction?
Process:
In a first phase of the project the focus was on the establishment of functioning cooperation structures. For this purpose, the working group of the city lab Leipzig was formed, consisting of representatives of the City of Leipzig (representatives of the Department of Urban Green Areas and Watercourses and the Department of Environmental Protection) and senior scientists of the UFZ (Department Urban and Environmental Sociology). Initially, the focus was on jointly developing the specific questions and problems for Leipzig and formulating the respective work tasks. Then it was a question of what contribution the EnRoute project can make to ongoing planning and work by the City of Leipzig, in particular to the Green Master Plan, which has been in preparation since 2017. This was a key choice that was essentially made by the representatives of the city.
In the second phase, the analysis of green infrastructure was developed. Based on very high resolution Digital Othophotos, a Digital Surface Model and ancillary vector data the UFZ team mapped green and grey structures for the year 2012. This detailed urban land use / land cover information served as a basis for further derivation of (spatial) indicators by intersection with other available data like vital statistics. At the meetings of the transdisciplinary working group the progress of the study was reflected and the mapping results were presented. In in spring 2018 the results were presented and discussed at the Sofia conference.
In the final third phase, the results are now incorporated into the current planning (the green master plan). Mapping has been published at a database with a data doi, and now passed on to the respective departments at the City of Leipzig. In order to make the project and its results known even more profoundly, a publication is prepared in autumn 2018, which will appear in an urban publication series. Furthermore, the Department of Urban Green Areas and Watercourses showed great interest in a joint monitoring procedure as a kind of follow-up project mapping green infrastructure in Leipzig for the year 2018. The precise reference to current plans of the City of Leipzig is an essential element for the success of the project. More than mapping, the city's interest lies in setting up such a green infrastructure monitoring system, that goes beyond the EnRoute concept. In this respect, mapping green infrastructure for 2012 laid an important foundation for closer collaboration, a mutual learning and understanding of scientists and planners, and, as mentioned above, the baseline to set up a monitoring system.
Key indicators for addressing these question(s):
There are two different spatial scales for which key indicators for ecosystems and their services have been elaborated and mapped. The scale of the entire city is valuable to compare the different cities in the EnRoute project. Table 1 illustrates the key indicators for green infrastructure that serve urban dwellers at metropolitan scale.
Table 1: Key Indicators
|
Key indicators at metropolitan scale |
|||
|
Population density |
18 |
Urban tree pattern: |
4,802.40 |
|
Land cover of green spaces [m² / inh.] |
254 |
Share of urban green infrastructure to total area of Leipzig (%) |
45.04 |
The second spatial scale refers to the scale of the local district which further divides the City of Leipzig. The planning level comprises all 63 local districts that represent the urban scale. At this scale inner urban differentiation is observed, mapped and quantified. Like so many other cities in Europe, Leipzig suffers from the urban heat island effect, and from heavy rainfall that causes locally allocated flooding. Therefore root penetration of vegetation such as from shrublands and young trees and shading effects from mature trees are major pieces of information.
Figure 1 illustrates the indicators of green infrastructure that serve urban dwellers at the urban scale. In this figure, all 63 local districts are named, the vegetation cover in hectare is displayed for shrubs and trees, and the absolute number of inhabitants is given. Therefore the indicator shrubs and young trees per inhabitants for each respective local district gives first information on vegetation that does not dry out fast in summer and hinders absolute soil dryness. The other indicator, tree coverage per local district per inhabitant is a key indicator for both, root penetration and shading. Figure 1 serves to illustrate that some local districts are well provided by vegetation cover, whereas other districts clearly lack of GI provision. Another aspect is to differentiate vegetation cover to increase awareness of the need of more shrubs, and / or for more shading from large trees.
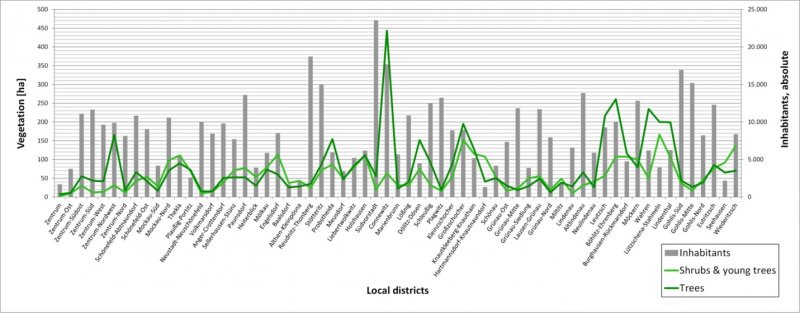
Figure 1 GI indicators serving urban dwellers at the urban scale
Key results:
A very fine scale mapping of green and grey structures has been carried out by an object-based image analysis technique (OBIA). This mapping is depicted at local district level and overlaid with vital statistics to gain a higher understanding of the demand for ecosystem services at the urban scale (Banzhaf et al. 2018b; Figure 2). The visualisiation of the results shall support the analysis of how political and governance instruments support the protection of green infrastructure and its ecosystem services.
One key goal was the enhancement of spatial information of urban land use and land cover from the cities spatial planning authorities. One key advantage of the produced data is that urban green structures in non-public areas (backyards, private grounds, etc.) can be assessed and analyzed in detail together with public spaces. This result contrasts common public mapping with a lack of spatially explicit information beyond public areas. For example, as municipal tree protection rules have been a constraint in their area of application for private land and a decrease of tree canopy coverage has been observed, a continued detailed green and grey structure mapping could serve well to monitor these developments and thus locate areas of higher demand for urban green.
Figure 2: Mapping grey and green structures for the city of Leipzig by means of very high resolution digital orthophotos, a digital elevation and a digital surface model
Policy relevance:
Leipzig is a growing city with green ambitions. It is one of Germany's greenest cities with an average of 254 m² green space per inhabitant. Leipzig is highly dynamic, so how can the city maintain or even enhance ecosystem services of green and blue infrastructure under the conditions of urban growth, land use pressure and recompaction? To better understand where urban green infrastructure is under pressure, the Leipzig EnRoute city lab mapped the presence of urban green space at high resolution and combined it with detailed population statistics. The mapping exercise provided an indispensable building block for the Green Master Plan, which is currently being prepared. An important lesson is that mapping should be combined with in situ green space monitoring of, for example, vegetation biomass. This would add value to remote sensing data and improve the capacity to assess ecosystem services provided by urban green space such as carbon dioxide removal. In addition, data were only available for 2012. An account based on time series of land cover and land use would help city planners to better understand to what extent urban green infrastructure is under pressure.
Due to shrinkage and deindustrialization in the 1990s, Leipzig had a large number of brownfields in most parts of the city (commercial brownfields covering an area of 517 ha in 2012; Banzhaf et.al. 2018a). In the course of the urban restructuring, new green spaces were created from it in the early 2000s: local district parks (Rabet, Lene-Voigt-Parc, Henrietten Parc), urban forests (Stadtgärtnerei-Holz, Schönauer Holz, Bürgerbahnhof Plagwitz), urban gardening projects and the Parkbogen Ost (a park band for Leipzig East) were developed. In addition, over 200 green interim uses were established on brownfields (Rink/Behne 2017). During that era, Leipzig pursued the guiding principle of "more green, less density" in its planning. The dynamic growth observed since the 2010s has led to additional land take for housing, social and technical infrastructure and commerce. Initially, many smaller brownfields were clustered and reused, but meanwhile complete new city districts are being planned or developed for several thousand inhabitants each on larger brownfield sites (Lindenauer Port, Eutritzscher Goods Station, Bavarian Station).
The city's new master plan now follows the model of "double inner development" (City of Leipzig 2018). Due to the higher number of inhabitants, an increased intensity of use on all green spaces, especially public green spaces such as parks, can be observed. In addition, change has taken place in the open space behaviour of youth groups which is reflected in an increase in active forms of use and events. The consequences are overuse of green spaces as well as different conflicts of use. The city administration in Leipzig is currently endeavouring to regulate the pressure of use and to preserve green spaces. Furthermore, ecosystem services, in particular local recreation, are to be further qualified. Regarding green infrastructure the decisive question is therefore:
How can the City of Leipzig maintain or even enhance ecosystem services of green and blue infrastructure under the conditions of dynamic urban growth, land use pressure and recompaction?
Conclusions:
The City of Leipzig has been very open minded to the approaches of green infrastructure and ecosystem services used in the project. In general, the planning status with regard to the urban green in Leipzig can be described as very advanced. However, the city is currently undergoing a fundamental change in terms of the protection and development of green infrastructure. In the 2000s the City of Leipzig was very innovative in the development and implementation of instruments for the revitalisation of brownfields and green spaces. With the so-called “Gestattungsvereinbarung” (licence agreement) and the interim uses, it became well-known throughout Germany and internationally. The city is still in the early stages of implementing the "double inner development" strategy. So far, no new instruments have been developed or tested for this purpose; this will also be the task of further research and cooperation.
Our data and modelling approach is based on remote sensing data and can therefore be applied to any city in Europe.
Limitations of the approach / data / models used:
Limitations of the mapping approach:
- Mapping accuracy: The UFZ team used a remote sensing based approach utilizing digital ortho photos. All remote sensing techniques map from above, and overlaid featured cannot be detected. As a consequence, GI features at ground level such as lawn/meadow and blue structures may be underestimated if covered by large trees and / or dominant shrubland.
Limitations concerning the combination with other data:
- Population statistics are freely available up to the local district level. The mapped data provides information at the scale of 60 cm in great detail. Thus a significant difference in information availability of analyzed data is apparent and aggregation necessary. As a consequence, expensive (paid for) population statistics at neighbourhood level would give a much more sophisticated insight, especially into local districts with a higher demand for GI and ecosystem services. So the funding budget limits a more detailed piece of information at this point.
As only data for one time step (2012) could be analyzed until the end of the project (due to data availability), the pressures resulting from a “growing city” (to which Leipzig is assigned) could be pictured much better in a monitoring procedure. For this reason further mapping is requested to capture changes in urban green and grey structures. Such information is of great importance and favoured by the policymakers.
Publications and reports:
Banzhaf, E., Arndt, T., Ladiges, J. (2018a): Potentials of urban brownfields for improving the quality of urban space. In: Kabisch, S., Koch, F., Gawel, E., Haase, A., Knapp, S., Krellenberg, K., Nivala, J., Zehnsdorf, A. (eds.) Urban transformations - Sustainable urban development through resource efficiency, quality of life and resilience. Future City 10 Springer International Publishing, Cham, pp. 221 – 232. https://doi.org/10.1080/02513625.2018.1487643.
Banzhaf, E., Kollai, H., Kindler, A. (2018b). Mapping urban grey and green structures for liveable cities using a 3D enhanced OBIA approach and vital statistics. Geocarto International. DOI: 10.1080/10106049.2018.1524514.
Banzhaf, E., Kabisch, S., Knapp, S., Rink, D., Wolff, M., Kindler, A. (2017): Integrated research on land use changes in the face of urban transformations – An analytic framework for further studies. Land Use Policy, 60, 403-407.
BBSR (2017): Handlungsziele für Stadtgrün und deren empirische Evidenz. Indikatoren, Kenn- und Orientierungswerte, Bonn
BfN (2017): Urbane Grüne Infrastruktur. Grundlage für attraktive und zukunftsfähige Städte. Hinweise für die kommunale Praxis, Berlin.
BfN (2017): Doppelte Innenentwicklung – Perspektiven für das urbane Grün. Empfehlungen für Kommunen, Bonn.
BMUB (2017): Weißbuch Stadtgrün. Grün in der Stadt – Für eine lebenswerte Zukunft, Berlin.
BMUB (2015): Grün in der Stadt. Für eine lebenswerte Zukunft. Grünbuch Stadtgrün, Berlin.
Rink, D., Arndt, T. (2016): Investigating perception of green structure configuration for afforestation in urban brownfield development by visual methods—A case study in Leipzig, Germany. Urban Forestry & Urban Greening, 15, 65–74.
Rink, D., Behne, S. (2017): Grüne Zwischennutzungen in der wachsenden Stadt: Die Gestattungsvereinbarung in Leipzig, für: Statistische Quartalsberichte, 1, S. 39-44.
Stadt Leipzig (2018a): Leipzig 2030. Integriertes Stadtentwicklungskonzept (INSEK), Leipzig
Stadt Leipzig (2018b): Fachkonzept Freiraum und Umwelt, in: dies.: Leipzig 2030. Integriertes Stadtentwicklungskonzept (INSEK), Leipzig
Stadt Leipzig, Amt für Stadtgrün und Gewässer (2017): Lebendig grüne Stadt am Wasser. Freiraumstrategie der Stadt Leipzig, Leipzig.
At UFZ, the EnRoute project is part of the integrated project "Urban Transformations" (see: https://www.ufz.de/index.php?de=36012). Here it is directly assigned to the Work Package "Urban Land Use & Ecosystem Services". In this work package, urban dynamics such as (extreme) growth and shrinkage are examined as fundamental challenges for urban land use. In this context, it is particularly important for sustainable urban development to design land use options and competition in such a way that urban ecosystem services can be adequately provided that contribute to improving quality of life and maintaining human health.